Note
Go to the end to download the full example code.
Draine-Li dust emission
Compare Draine & Li (2007) dust emission across the radiation field grid. This example assigns a set of synthetic minimum radiation fields (umin) across the valid range of the DL07 grid, one per particle, and generates the corresponding dust emission spectra in a single call, normalised to their bolometric luminosity.
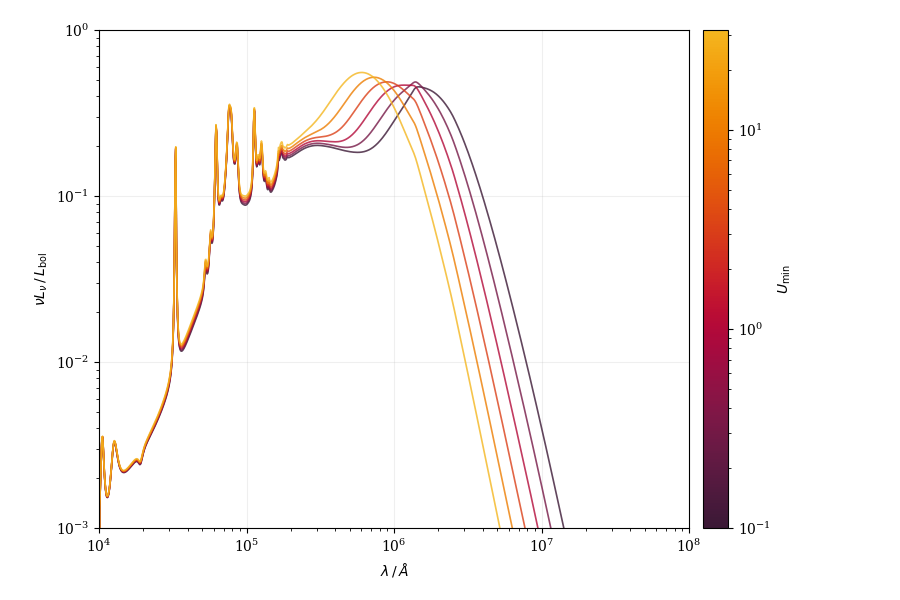
import sys

import cmasher as cmr
import matplotlib.pyplot as plt
import numpy as np
from matplotlib import cm
from matplotlib import colors as mpl_colors
from unyt import Lsun, Msun, angstrom

from synthesizer.emission_models.generators.dust import DraineLi07

plt.rcParams["font.family"] = "DeJavu Serif"
plt.rcParams["font.serif"] = ["Times New Roman"]

DEFAULT_N_EXAMPLES = 6
UMIN_LOG10_LIMITS = (-1.0, 1.5)
DUST_MASS = 1.0e8 * Msun
HYDROGEN_MASS = 1.0e10 * Msun
DUST_LUMINOSITY = 1.0e10 * Lsun
PLOT_X_LIMITS = (1.0e4 * angstrom, 1.0e8 * angstrom)
PLOT_Y_LIMITS = (1.0e-3, 1.0)


def make_umin_setup(draine_li, n_examples):
    """Construct the minimum radiation fields for the examples."""
    # Select a simple monotonic umin sequence across the part of the grid we
    # want to visualise.
    if draine_li._axis_names[1] == "log10umin":
        umin_limits = (
            10
            ** max(
                UMIN_LOG10_LIMITS[0], draine_li._grid_axis_min["log10umin"]
            ),
            10
            ** min(
                UMIN_LOG10_LIMITS[1], draine_li._grid_axis_max["log10umin"]
            ),
        )
    else:
        umin_limits = (
            max(10 ** UMIN_LOG10_LIMITS[0], draine_li._grid_axis_min["umin"]),
            min(10 ** UMIN_LOG10_LIMITS[1], draine_li._grid_axis_max["umin"]),
        )

    return np.geomspace(umin_limits[0], umin_limits[1], n_examples)


def parse_command_line():
    """Parse optional command line arguments for the example."""
    n_examples = DEFAULT_N_EXAMPLES
    if len(sys.argv) > 1:
        n_examples = int(sys.argv[1])

    return max(1, n_examples)


def main():
    """Run the Draine-Li dust emission validation example."""
    # Allow the number of sampled radiation fields to be overridden from the
    # command line while keeping the default example light enough for
    # documentation.
    n_examples = parse_command_line()

    # Define the wavelengths we want the dust emission on
    lam = np.logspace(4, 8, 1000) * angstrom

    draine_li = DraineLi07(
        lam=lam,
        grid_name="draine_li_dust_emission_grid_MW_3p1",
        grid_dir=None,
        hydrogen_mass=HYDROGEN_MASS,
        qpah=0.025,
        gamma=0.05,
        alpha=2.0,
    )

    # Build the synthetic radiation field setups we want to compare, one per
    # particle.
    umins = make_umin_setup(draine_li, n_examples)
    setup = draine_li._setup_dl07_parameters(
        np.full(n_examples, DUST_MASS.value) * DUST_MASS.units,
        DUST_LUMINOSITY,
        umin=umins,
    )

    # Generate the dust emission for every umin in one call, and normalise
    # each spectrum to its bolometric luminosity.
    sed = draine_li._generate_dl07_spectra(lam, setup)
    # (atleast_2d/1d keep a single umin working, which has no particle axis)
    normalised = (
        np.atleast_2d(sed.luminosity.value)
        / np.atleast_1d(sed.bolometric_luminosity.value)[:, None]
    )

    # Prepare the figure and the colour map used for the umin sequence.
    fig, spec_ax = plt.subplots(1, 1, figsize=(9, 6))
    cmap = cmr.get_sub_cmap("cmr.ember", 0.2, 0.9)
    norm = mpl_colors.LogNorm(vmin=umins.min(), vmax=umins.max())
    scalar_mappable = cm.ScalarMappable(norm=norm, cmap=cmap)

    # Plot the Draine-Li dust emission for each umin.
    for umin, spectrum in zip(umins, normalised):
        spec_ax.loglog(
            lam,
            spectrum,
            color=cmap(norm(umin)),
            lw=1.2,
            alpha=0.8,
        )

    # Format the spectra panel.
    spec_ax.set_xlim(PLOT_X_LIMITS[0].value, PLOT_X_LIMITS[1].value)
    spec_ax.set_ylim(*PLOT_Y_LIMITS)
    spec_ax.set_xlabel(r"$\lambda\,/\,\AA$")
    spec_ax.set_ylabel(r"$\nu L_{\nu}\,/\,L_{\mathrm{bol}}$")
    spec_ax.grid(True, which="major", alpha=0.2)

    colorbar = fig.colorbar(
        scalar_mappable,
        ax=spec_ax,
        pad=0.02,
    )
    colorbar.set_label(r"$U_{\mathrm{min}}$")

    fig.subplots_adjust(
        left=0.11,
        right=0.9,
        bottom=0.12,
        top=0.95,
    )
    plt.show()


if __name__ == "__main__":
    main()
Total running time of the script: (0 minutes 0.667 seconds)