Note
Go to the end to download the full example code.
Extreme model variations example
This example pushes parameter variations to the extreme end of the scale, to show how the machinery can handle hundreds of variation values and tens of thousands of models.
Two models are built. The first varies one thing a lot: three hundred ISM optical depths from a single list. The second varies five things at once, in every way a variation can be declared:
the escape fraction is sampled from a distribution
the birth cloud is attenuated by a list of different dust curves and by a list of optical depths. Those are separate declarations and therefore separate axes, so every (curve, depth) pair appears
the ISM is attenuated by one curve over a list of optical depths
the dust emission temperature is varied on the generator itself
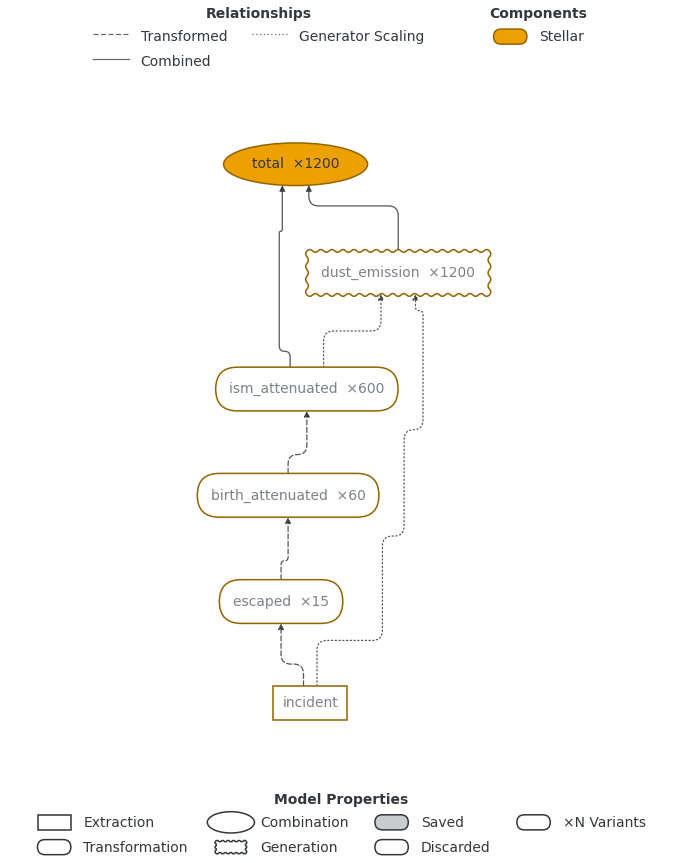
Variation axes multiply, so the count is the product of the five. The models no variation can reach are still computed once however many variants there are, which is what makes any of this affordable.
Two scales. The default is sized for the documentation build, which has to
run every example on a shared machine. Pass --full for the scale the
machinery is actually meant for, or set the counts yourself:
python plot_extreme_variations.py –full python plot_extreme_variations.py –n-fesc 100 –n-ism-tau 100
For reference, measured on a laptop with the test grid (9,244 wavelengths, so each spectrum is 74 KB and every model holds one while generating):
variants |
models |
expand |
spectra |
whole run |
|---|---|---|---|---|
1,200 (default) |
3,076 |
0.3 s |
1.1 s |
14 s, 1.7 GB |
20,000 ( |
50,501 |
53 s |
20 s |
90 s, 7.0 GB |
36,000 |
91,001 |
174 s |
38 s |
Expansion grows faster than linearly, since each variation re-derives the label keyed view of every model, but it happens once however many emitters follow: the 53 s above is paid once against the cost of generating every variant for every galaxy. Memory is set by the model count, at roughly four times one spectrum per model, and that is the number worth watching.
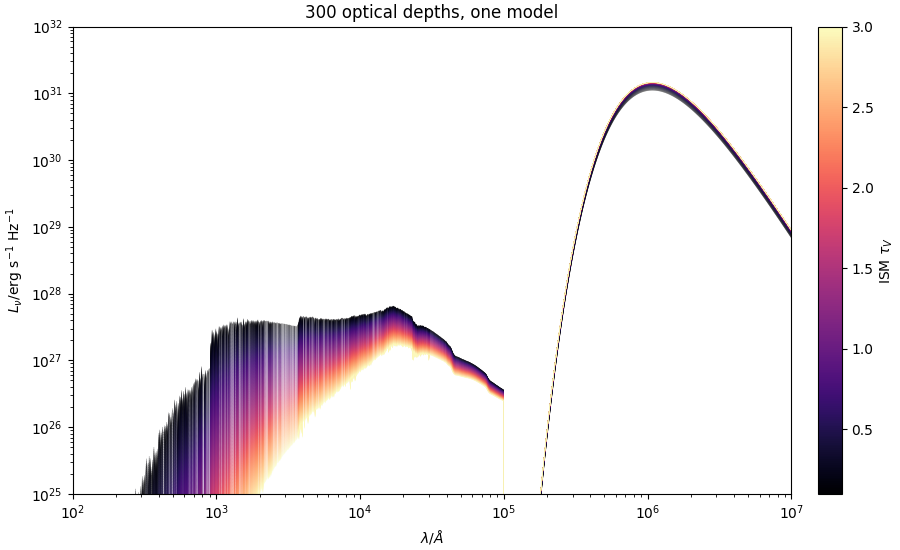
Three hundred ISM optical depths from a single list:
/opt/hostedtoolcache/Python/3.10.22/x64/lib/python3.10/site-packages/unyt/array.py:1900: RuntimeWarning: overflow encountered in exp
  out_arr = func(np.asarray(inp), out=out_func, **kwargs)
/opt/hostedtoolcache/Python/3.10.22/x64/lib/python3.10/site-packages/unyt/array.py:2040: RuntimeWarning: overflow encountered in multiply
  out_arr = func(
   300 variants from 6 declared models: 903 models in 0.02 s, spectra in 0.62 s
   one model per variant would have needed 1800 models

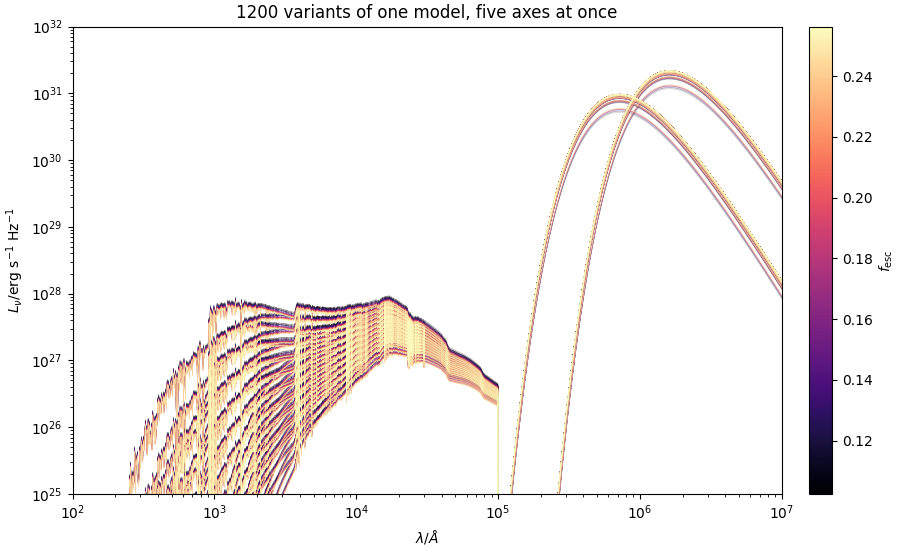
Five axes at once: 15 escape fractions x 2 birth curves x 2 birth depths x 10 ISM depths x 2 temperatures = 1200 variants (pass --full for 20,000)
   1200 variants from 6 declared models: 3076 models in 0.47 s, spectra in 2.37 s
   one model per variant would have needed 7200 models
   the birth cloud has all 4 (curve, depth) pairs, from two declarations on one model
import argparse
import time

import matplotlib.pyplot as plt
import numpy as np
from matplotlib.collections import LineCollection
from unyt import Msun, Myr, kelvin

from synthesizer.emission_models import (
    AttenuatedEmission,
    DustEmission,
    Greybody,
    StellarEmissionModel,
)
from synthesizer.emission_models.attenuation import Calzetti2000, PowerLaw
from synthesizer.emission_models.parameters import (
    ParameterList,
    ParameterNormalDist,
)
from synthesizer.emission_models.transformers import EscapingFraction
from synthesizer.grid import Grid
from synthesizer.parametric import SFH, Stars, ZDist
from synthesizer.parametric.galaxy import Galaxy

# The dust curves the birth clouds are varied over
BIRTH_CURVES = [
    PowerLaw(slope=-0.5),
    PowerLaw(slope=-1.3),
    Calzetti2000(),
]

# What the documentation build can afford: 1,200 variants in 3,076 models
DOCS_SCALE = {
    "n_fesc": 15,
    "n_curves": 2,
    "n_birth_tau": 2,
    "n_ism_tau": 10,
    "n_temp": 2,
}

# The scale the machinery is meant for: 20,000 variants in 50,501 models
FULL_SCALE = {
    "n_fesc": 100,
    "n_curves": 2,
    "n_birth_tau": 2,
    "n_ism_tau": 25,
    "n_temp": 2,
}


def varied_model(grid, n_fesc, n_curves, n_birth_tau, n_ism_tau, n_temp):
    """Build a model varied along up to five axes.

    Args:
        grid (Grid): The grid to extract from.
        n_fesc (int): How many escape fractions to sample. One means fixed.
        n_curves (int): How many birth cloud dust curves to use.
        n_birth_tau (int): How many birth cloud optical depths to use.
        n_ism_tau (int): How many ISM optical depths to use.
        n_temp (int): How many dust temperatures to use.

    Returns:
        StellarEmissionModel: The unexpanded model.
    """
    incident = StellarEmissionModel(
        label="incident",
        grid=grid,
        extract="incident",
    )

    # A distribution, sampled once up front rather than once per branch. With
    # this many samples the labels need the precision to tell them apart,
    # which is why the format string is what it is.
    escaped = StellarEmissionModel(
        label="escaped",
        apply_to=incident,
        transformer=EscapingFraction(("fesc",)),
        fesc=(
            ParameterNormalDist(
                0.2,
                0.05,
                n_fesc,
                seed=42,
                label_modifier="fesc%.5f",
            )
            if n_fesc > 1
            else 0.2
        ),
    )

    # Two declarations on one model. The curve and the optical depth are
    # independent, so this is every (curve, depth) pair.
    birth = AttenuatedEmission(
        label="birth_attenuated",
        apply_to=escaped,
        emitter="stellar",
        dust_curve=(
            ParameterList(
                BIRTH_CURVES[:n_curves],
                labels=[f"curve{i}" for i in range(n_curves)],
            )
            if n_curves > 1
            else BIRTH_CURVES[0]
        ),
        tau_v=(
            ParameterList(
                list(np.linspace(0.2, 1.0, n_birth_tau)),
                label_modifier="btau%.3f",
            )
            if n_birth_tau > 1
            else 0.5
        ),
    )

    # One curve, a long list of optical depths
    ism = AttenuatedEmission(
        label="ism_attenuated",
        apply_to=birth,
        emitter="stellar",
        dust_curve=PowerLaw(slope=-0.7),
        tau_v=ParameterList(
            list(np.linspace(0.1, 3.0, n_ism_tau)),
            label_modifier="itau%.4f",
        ),
    )

    # A parameter of the generator rather than of the model
    dust = DustEmission(
        dust_emission_model=Greybody(
            temperature=(
                ParameterList(
                    [(20 + 25 * i) * kelvin for i in range(n_temp)],
                    label_modifier="T%dK",
                )
                if n_temp > 1
                else 30 * kelvin
            ),
            emissivity=1.5,
        ),
        emitter="stellar",
        label="dust_emission",
        dust_lum_intrinsic=incident,
        dust_lum_attenuated=ism,
    )

    return StellarEmissionModel(
        label="total",
        combine=(ism, dust),
        related_models=(escaped,),
    )


def expand_and_generate(model, galaxy):
    """Expand a model, generate every variant, and report what it cost.

    Args:
        model (EmissionModel): The unexpanded model.
        galaxy (Galaxy): The galaxy to generate the emission for.

    Returns:
        expanded (EmissionModel): The expanded model.
        totals (list): The variants of the total emission.
    """
    declared = len(model._models)

    start = time.perf_counter()
    expanded = model.expand_models()
    expansion = time.perf_counter() - start

    totals = expanded.select("total*")

    # Only the totals are wanted out the other side
    expanded.save_spectra("total*")

    start = time.perf_counter()
    galaxy.stars.get_spectra(expanded)
    generation = time.perf_counter() - start

    print(
        f"   {len(totals)} variants from {declared} declared models: "
        f"{len(expanded._models)} models in {expansion:.2f} s, "
        f"spectra in {generation:.2f} s"
    )
    print(
        "   one model per variant would have needed "
        f"{declared * len(totals)} models"
    )

    return expanded, totals


def draw_spectra(galaxy, totals, colour_by, label, title, fixed_value=None):
    """Draw every variant, coloured by one of the varied parameters.

    Thousands of separate lines are slow to draw one at a time, so they go in
    as a single collection.

    Args:
        galaxy (Galaxy): The galaxy the spectra were generated for.
        totals (list): The variants of the total emission.
        colour_by (str): The varied parameter which carries the colour.
        label (str): The label for the colour bar.
        title (str): The plot title.
        fixed_value: The parameter value when it was not varied.
    """
    variant_values = [
        model.variant_params.get(colour_by, fixed_value) for model in totals
    ]
    values = sorted(set(variant_values))
    colours = plt.cm.magma(np.linspace(0.0, 1.0, len(values)))

    segments = []
    line_colours = []
    for variant, value in zip(totals, variant_values):
        spectra = galaxy.stars.spectra[variant.label]
        segments.append(
            np.column_stack(
                [spectra.lam.value, np.clip(spectra.lnu.value, 1e-40, None)]
            )
        )
        line_colours.append(colours[values.index(value)])

    fig, ax = plt.subplots(figsize=(9, 5.5), constrained_layout=True)
    ax.add_collection(
        LineCollection(
            segments,
            colors=line_colours,
            linewidths=0.3,
            alpha=0.3,
        )
    )
    ax.set_xscale("log")
    ax.set_yscale("log")
    ax.set_xlim(1e2, 1e7)
    ax.set_ylim(1e25, 1e32)
    ax.set_xlabel(r"$\lambda / \AA$")
    ax.set_ylabel(r"$L_{\nu} / \mathrm{erg\ s^{-1}\ Hz^{-1}}$")
    ax.set_title(title)

    # A colour bar rather than a legend: there is one parameter worth reading
    # off this many curves, and the rest are left to the spread
    bar = fig.colorbar(
        plt.cm.ScalarMappable(
            cmap="magma",
            norm=plt.Normalize(vmin=min(values), vmax=max(values)),
        ),
        ax=ax,
        pad=0.02,
    )
    bar.set_label(label)

    plt.show()


if __name__ == "__main__":
    parser = argparse.ArgumentParser(
        description=(
            "Expand a model varied along five axes at once, generate every "
            "variant and plot them"
        )
    )
    parser.add_argument(
        "-grid_name",
        type=str,
        default="test_grid",
        help="the SPS grid to use",
    )
    parser.add_argument(
        "--full",
        action="store_true",
        help=(
            "run at the scale the machinery is meant for (20,000 variants "
            "in 50,501 models) rather than the size the docs build can "
            "afford"
        ),
    )
    parser.add_argument(
        "--n-fesc",
        type=int,
        default=None,
        help="how many escape fractions to sample from the distribution",
    )
    parser.add_argument(
        "--n-curves",
        type=int,
        default=None,
        help=(
            "how many birth cloud dust curves to use (max "
            f"{len(BIRTH_CURVES)})"
        ),
    )
    parser.add_argument(
        "--n-birth-tau",
        type=int,
        default=None,
        help="how many birth cloud optical depths to use",
    )
    parser.add_argument(
        "--n-ism-tau",
        type=int,
        default=None,
        help="how many ISM optical depths to use",
    )
    parser.add_argument(
        "--n-temp",
        type=int,
        default=None,
        help="how many dust emission temperatures to use",
    )
    args = parser.parse_args()

    # The docs build runs every example on a shared machine, so the default is
    # small. Nothing here is a limit of the machinery: --full is a measured
    # 50,501 models, and anything the machine can hold works.
    preset = FULL_SCALE if args.full else DOCS_SCALE
    axes = {
        name: getattr(args, name) or default
        for name, default in preset.items()
    }

    grid = Grid(args.grid_name)

    galaxy = Galaxy(
        stars=Stars(
            grid.log10ages,
            grid.metallicities,
            sf_hist=SFH.Constant(max_age=100 * Myr),
            metal_dist=ZDist.Normal(mean=0.01, sigma=0.005),
            initial_mass=1e8 * Msun,
        )
    )

    # One axis, three hundred values
    print("Three hundred ISM optical depths from a single list:")
    wide, wide_totals = expand_and_generate(
        varied_model(
            grid,
            n_fesc=1,
            n_curves=1,
            n_birth_tau=1,
            n_ism_tau=300,
            n_temp=1,
        ),
        galaxy,
    )
    draw_spectra(
        galaxy,
        wide_totals,
        "tau_v",
        r"ISM $\tau_V$",
        f"{len(wide_totals)} optical depths, one model",
    )

    # Five axes at once, at whichever scale was asked for
    expected = (
        axes["n_fesc"]
        * axes["n_curves"]
        * axes["n_birth_tau"]
        * axes["n_ism_tau"]
        * axes["n_temp"]
    )
    print(
        f"\nFive axes at once: {axes['n_fesc']} escape fractions x "
        f"{axes['n_curves']} birth curves x {axes['n_birth_tau']} birth "
        f"depths x {axes['n_ism_tau']} ISM depths x {axes['n_temp']} "
        f"temperatures = {expected} variants"
        + ("" if args.full else " (pass --full for 20,000)")
    )
    everything, totals = expand_and_generate(
        varied_model(grid, **axes),
        galaxy,
    )

    # Every axis multiplied out, including the two declared on one model
    assert len(totals) == expected, (
        f"expected {expected} variants, got {len(totals)}"
    )
    # The birth cloud carries two declarations, so it should hold every
    # (curve, depth) pair. Only worth checking when both are being varied.
    if axes["n_curves"] > 1 and axes["n_birth_tau"] > 1:
        birth_pairs = {
            (
                model.variant_params["transformer"],
                model.variant_params["tau_v"],
            )
            for model in everything.select("birth_attenuated*")
        }
        assert len(birth_pairs) == axes["n_curves"] * axes["n_birth_tau"], (
            f"expected every (curve, depth) pair, got {len(birth_pairs)}"
        )
        print(
            f"   the birth cloud has all {len(birth_pairs)} (curve, depth) "
            "pairs, from two declarations on one model"
        )

    draw_spectra(
        galaxy,
        totals,
        "fesc",
        r"$f_{\mathrm{esc}}$",
        f"{len(totals)} variants of one model, five axes at once",
        fixed_value=0.2,
    )

    # The network, collapsed. Each family is one node badged with its count,
    # so this stays readable however many variants there are, which drawing
    # them separately does not.
    everything.plot_emission_graph(show=True)

    # Nothing above is left waiting: the spectra plots show themselves and the
    # graph is asked to, but a final call means any figure a reader adds to the
    # end of this script still appears
    plt.show()
Total running time of the script: (0 minutes 8.578 seconds)