Note
Go to the end to download the full example code.
Compare smoothed and point-particle LOS column densities
This example compares line-of-sight dust column densities computed by treating the input particles as point sources and by averaging over their smoothing kernels.
This also profiles the point-particle loop path, the point-particle tree path, and the smoothed-input tree path on the same particle distribution.
Pass --refine to resample the CAMELS seed geometry up to a larger particle
set for a more demanding timing comparison.
Point-particle loop LOS column densities took 0.0018 s for nstars=278 and ngas=64
Point-particle tree LOS column densities took 0.0005 s for nstars=278 and ngas=64
Smoothed-input tree LOS column densities took 3.6938 s for nstars=278 and ngas=64
Point tree / loop timing ratio: 0.2495
Smoothed tree / point tree timing ratio: 8014.8665
Point-path residual (tree vs loop): 1.5259e-04 Msun/Mpc**2
Column density sums: point-loop=1.2118e+13 Msun/Mpc**2, point-tree=1.2118e+13 Msun/Mpc**2, smoothed=1.0445e+13 Msun/Mpc**2
import argparse
import time
import matplotlib.pyplot as plt
import numpy as np
from synthesizer import TEST_DATA_DIR
from synthesizer.kernel_functions import Kernel
from synthesizer.load_data.load_camels import load_CAMELS_IllustrisTNG
from synthesizer.particle.galaxy import Galaxy
from synthesizer.particle.gas import Gas
from synthesizer.particle.stars import Stars
plt.rcParams["font.family"] = "DeJavu Serif"
plt.rcParams["font.serif"] = ["Times New Roman"]
# Parse optional arguments. Use parse_known_args so the example remains robust
# when run by external tooling that may add unrelated command-line arguments.
parser = argparse.ArgumentParser()
parser.add_argument(
"--refine",
action="store_true",
help=(
"Resample the CAMELS seed geometry to 1000 stars and 10000 gas "
"particles before running the LOS comparison."
),
)
args, _ = parser.parse_known_args()
# Set the seed
np.random.seed(42)
# Load the CAMELS test galaxies and select one with both stars and gas. The
# local test snapshot is small, so we optionally resample around it when the
# refine flag is enabled.
camels_galaxies = load_CAMELS_IllustrisTNG(
TEST_DATA_DIR,
snap_name="camels_snap.hdf5",
group_name="camels_subhalo.hdf5",
group_dir=TEST_DATA_DIR,
)
template_galaxy = camels_galaxies[0]
def resample_coordinates(coordinates, smoothing_lengths, nparticles):
"""Resample a particle distribution around a template geometry."""
# Draw particles with replacement from the small CAMELS seed system, then
# jitter them by a fraction of their smoothing length. This preserves the
# rough spatial scale and LOS geometry of the template while creating a
# larger benchmark problem for the tree and loop implementations.
indices = np.random.choice(
coordinates.shape[0], size=nparticles, replace=True
)
base_coords = coordinates[indices].to("Mpc")
base_smls = smoothing_lengths[indices].to("Mpc")
jitter = np.random.normal(0.0, 0.25, size=(nparticles, 3))
return base_coords + base_smls[:, None] * jitter, base_smls
if args.refine:
# Build a larger synthetic system with the same broad geometry as the local
# CAMELS example. This keeps the example self-contained while still
# giving a more demanding comparison between the LOS algorithms.
nstars = 1000
ngas = 10000
star_coords, star_smls = resample_coordinates(
template_galaxy.stars.coordinates,
template_galaxy.stars.smoothing_lengths,
nstars,
)
star_indices = np.random.choice(
template_galaxy.stars.nparticles,
size=nstars,
replace=True,
)
stars = Stars(
initial_masses=template_galaxy.stars.initial_masses[star_indices],
ages=template_galaxy.stars.ages[star_indices],
metallicities=template_galaxy.stars.metallicities[star_indices],
redshift=template_galaxy.redshift,
coordinates=star_coords,
current_masses=template_galaxy.stars.current_masses[star_indices],
smoothing_lengths=star_smls,
)
gas_coords, gas_smls = resample_coordinates(
template_galaxy.gas.coordinates,
template_galaxy.gas.smoothing_lengths,
ngas,
)
gas_indices = np.random.choice(
template_galaxy.gas.nparticles,
size=ngas,
replace=True,
)
gas = Gas(
masses=template_galaxy.gas.masses[gas_indices],
metallicities=template_galaxy.gas.metallicities[gas_indices],
star_forming=template_galaxy.gas.star_forming[gas_indices],
redshift=template_galaxy.redshift,
coordinates=gas_coords,
smoothing_lengths=gas_smls,
dust_to_metal_ratio=template_galaxy.gas.dust_to_metal_ratio,
)
galaxy = Galaxy("Refined CAMELS Galaxy", stars=stars, gas=gas, redshift=1)
else:
galaxy = template_galaxy
nstars = galaxy.stars.nparticles
ngas = galaxy.gas.nparticles
# Use a Kernel instance so both the point-particle and smoothed-input paths
# can access the look-up tables they need. In point mode the projected kernel
# is used, while in smoothed mode the same object also provides the overlap
# table needed to average the LOS column density across the input-particle
# support.
kernel = Kernel(name="cubic", binsize=256)
# Calculate LOS dust column densities in three configurations:
#
# 1. point-particle loop: evaluate the point-particle LOS approximation with a
# direct double loop,
# 2. point-particle tree: evaluate the same point-particle approximation with
# tree acceleration,
# 3. smoothed-input tree: evaluate the kernel-averaged LOS column density by
# averaging over the stellar smoothing kernel.
#
# Comparing all three in one place makes it clear how much the tree helps for
# the point-particle approximation and what extra cost is paid for the
# kernel-averaged smoothed-input treatment.
start = time.time()
point_loop_col_den = galaxy.stars.get_los_column_density(
galaxy.gas,
"dust_masses",
kernel=kernel,
as_points=True,
force_loop=1,
)
point_loop_time = time.time() - start
start = time.time()
point_tree_col_den = galaxy.stars.get_los_column_density(
galaxy.gas,
"dust_masses",
kernel=kernel,
as_points=True,
force_loop=0,
min_count=32,
)
point_tree_time = time.time() - start
start = time.time()
smoothed_col_den = galaxy.stars.get_los_column_density(
galaxy.gas,
"dust_masses",
kernel=kernel,
as_points=False,
force_loop=0,
min_count=32,
)
smoothed_time = time.time() - start
# Report both the absolute timings and a few simple diagnostics. The point-path
# residual should stay small because the loop and tree are evaluating the same
# point-particle problem, while the smoothed-input sum is expected to differ
# because it is solving a different, kernel-averaged LOS problem.
print(
f"Point-particle loop LOS column densities took {point_loop_time:.4f} s "
f"for nstars={nstars} and ngas={ngas}"
)
print(
f"Point-particle tree LOS column densities took {point_tree_time:.4f} s "
f"for nstars={nstars} and ngas={ngas}"
)
print(
f"Smoothed-input tree LOS column densities took {smoothed_time:.4f} s "
f"for nstars={nstars} and ngas={ngas}"
)
print(
f"Point tree / loop timing ratio: {point_tree_time / point_loop_time:.4f}"
)
print(
f"Smoothed tree / point tree timing ratio: "
f"{smoothed_time / point_tree_time:.4f}"
)
print(
f"Point-path residual (tree vs loop): "
f"{np.max(np.abs(point_tree_col_den - point_loop_col_den)):.4e}"
)
print(
f"Column density sums: point-loop={np.sum(point_loop_col_den):.4e}, "
f"point-tree={np.sum(point_tree_col_den):.4e}, "
f"smoothed={np.sum(smoothed_col_den):.4e}"
)
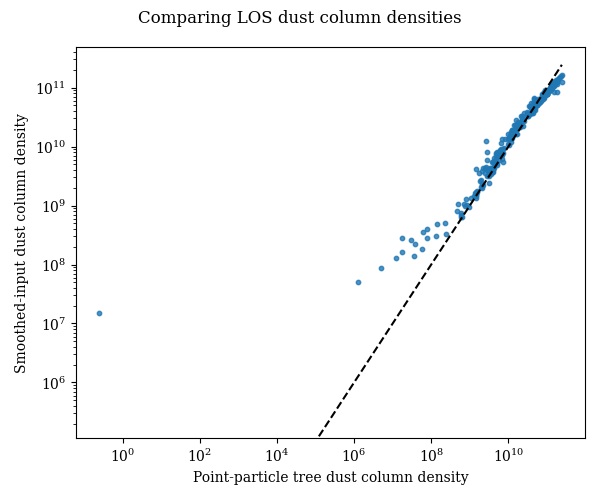
# Plot the point-tree and smoothed-input answers against one another. The
# dashed one-to-one line is only a visual guide: departures from that line are
# expected because the smoothed-input result averages over each stellar kernel
# rather than evaluating the LOS column density only at the stellar centre.
fig, ax = plt.subplots(figsize=(6, 5))
ax.scatter(point_tree_col_den, smoothed_col_den, s=10, alpha=0.8)
ax.plot(
[np.min(point_tree_col_den), np.max(point_tree_col_den)],
[np.min(point_tree_col_den), np.max(point_tree_col_den)],
linestyle="--",
color="black",
)
ax.set_xscale("log")
ax.set_yscale("log")
ax.set_xlabel("Point-particle tree dust column density")
ax.set_ylabel("Smoothed-input dust column density")
fig.suptitle("Comparing LOS dust column densities")
fig.tight_layout()
plt.show()
Total running time of the script: (0 minutes 3.961 seconds)