Note
Go to the end to download the full example code.
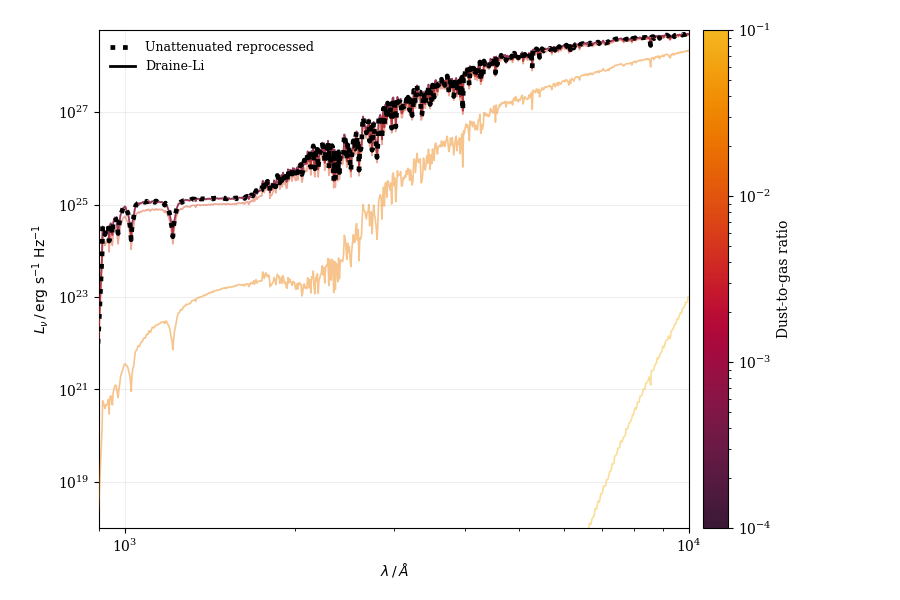
Draine-Li attenuation validation
Compare Draine-Li grain attenuation for a CAMELS-IllustrisTNG galaxy. This example generates a reprocessed spectrum for a single galaxy, assigns a set of synthetic dust-to-gas ratios across the valid Draine-Li grid range, and then applies the corresponding attenuation curves by hand.
/opt/hostedtoolcache/Python/3.10.20/x64/lib/python3.10/site-packages/unyt/array.py:2040: RuntimeWarning: invalid value encountered in divide
  out_arr = func(
import sys

import cmasher as cmr
import matplotlib.pyplot as plt
import numpy as np
from matplotlib import cm
from matplotlib import colors as mpl_colors
from matplotlib.lines import Line2D
from unyt import Msun, angstrom, pc

from synthesizer import TEST_DATA_DIR
from synthesizer.emission_models import (
    IncidentEmission,
    NebularContinuumEmission,
    NebularEmission,
    NebularLineEmission,
    ReprocessedEmission,
    TransmittedEmission,
)
from synthesizer.emission_models.attenuation import DraineLiGrainCurves
from synthesizer.grid import Grid
from synthesizer.load_data.load_camels import load_CAMELS_IllustrisTNG

plt.rcParams["font.family"] = "DeJavu Serif"
plt.rcParams["font.serif"] = ["Times New Roman"]

DEFAULT_N_EXAMPLES = 6
DRAINE_LI_MEAN_MOLECULAR_WEIGHT = 1.4
FIXED_HYDROGEN_COLUMN = 1.0e3 * Msun / pc**2
DTG_LOG10_LIMITS = (-4.0, -1.0)
PLOT_X_LIMITS = (900 * angstrom, 1.0e4 * angstrom)
PLOT_Y_MIN = 1.0e18
DUST_COMPONENT_FRACTIONS = {
    "sigmalos_graphite_a0p01um": 0.18,
    "sigmalos_graphite_a0p1um": 0.32,
    "sigmalos_silicate_a0p01um": 0.12,
    "sigmalos_silicate_a0p1um": 0.38,
}


def build_reprocessed_sed(galaxy, grid):
    """Build a deterministic reprocessed spectrum for the chosen galaxy."""
    # Build the emission-model components explicitly so the example avoids the
    # helper warnings produced when ReprocessedEmission auto-constructs them.
    incident = IncidentEmission(grid)
    transmitted = TransmittedEmission(grid, fesc=0.0, incident=incident)
    nebular_line = NebularLineEmission(grid, fesc_ly_alpha=0.0)
    nebular_continuum = NebularContinuumEmission(grid)
    nebular = NebularEmission(
        grid,
        nebular_line=nebular_line,
        nebular_continuum=nebular_continuum,
    )
    reprocessed = ReprocessedEmission(
        grid,
        fesc=0.0,
        transmitted=transmitted,
        nebular=nebular,
    )

    # Generate the integrated reprocessed spectrum.
    return galaxy.stars.get_spectra(reprocessed)


def make_column_density_setup(draine_li, n_examples):
    """Construct the hydrogen columns and dust mixtures for the examples."""
    # Select a simple monotonic DTG sequence across the part of the grid we
    # want to visualise.
    if draine_li._dtg_axis_name == "log10dtg":
        dtg_limits = (
            10 ** max(DTG_LOG10_LIMITS[0], draine_li._grid_dtg_min),
            10 ** min(DTG_LOG10_LIMITS[1], draine_li._grid_dtg_max),
        )
    else:
        dtg_limits = (
            max(10 ** DTG_LOG10_LIMITS[0], draine_li._grid_dtg_min),
            min(10 ** DTG_LOG10_LIMITS[1], draine_li._grid_dtg_max),
        )
    dust_to_gas_ratios = np.geomspace(
        dtg_limits[0],
        dtg_limits[1],
        n_examples,
    )

    # Hold the hydrogen column fixed so the example isolates DTG-driven
    # attenuation changes.
    hydrogen_columns = (
        np.full(n_examples, FIXED_HYDROGEN_COLUMN.value)
        * FIXED_HYDROGEN_COLUMN.units
    )
    dust_columns = (
        DRAINE_LI_MEAN_MOLECULAR_WEIGHT * hydrogen_columns * dust_to_gas_ratios
    )

    return (
        hydrogen_columns,
        dust_columns,
        dust_to_gas_ratios,
        DUST_COMPONENT_FRACTIONS,
    )


def build_dust_component_columns(dust_columns, component_fractions):
    """Split the total dust column into the Draine-Li grain components."""
    return {
        component_name: dust_columns * fraction
        for component_name, fraction in component_fractions.items()
    }


def parse_command_line():
    """Parse optional command line arguments for the example."""
    n_examples = DEFAULT_N_EXAMPLES
    if len(sys.argv) > 1:
        n_examples = int(sys.argv[1])

    return max(1, n_examples)


def main():
    """Run the Draine-Li attenuation validation example."""
    # Allow the number of sampled galaxies to be overridden from the command
    # line while keeping the default example light enough for documentation.
    n_examples = parse_command_line()

    # Load the CAMELS galaxy used throughout the cosmological examples.
    galaxies = load_CAMELS_IllustrisTNG(
        TEST_DATA_DIR,
        snap_name="camels_snap.hdf5",
        group_name="camels_subhalo.hdf5",
    )
    galaxy = galaxies[1]

    # Create the test grid for wavelengths
    grid = Grid("test_grid")

    draine_li = DraineLiGrainCurves(
        lam=grid.lam,
        grid_name="dust_extcurve_draine_li_lognormal_asmall0p01_alarge0p1_apah0p001",
        grid_dir=None,
        grain_dict={
            "graphite": [0.01, 0.1],
            "silicate": [0.01, 0.1],
        },
    )

    # Build the intrinsic reprocessed spectrum that we will attenuate by hand.
    reprocessed_sed = build_reprocessed_sed(galaxy, grid)

    # Build the synthetic line-of-sight dust setups we want to compare.
    (
        hydrogen_columns,
        dust_columns,
        dust_to_gas_ratios,
        component_fractions,
    ) = make_column_density_setup(draine_li, n_examples)
    dust_component_columns = build_dust_component_columns(
        dust_columns,
        component_fractions,
    )

    # Prepare the figure and the colour map used for the DTG sequence.
    fig, spec_ax = plt.subplots(1, 1, figsize=(9, 6))
    cmap = cmr.get_sub_cmap("cmr.ember", 0.2, 0.9)
    norm = mpl_colors.LogNorm(
        vmin=dust_to_gas_ratios.min(),
        vmax=dust_to_gas_ratios.max(),
    )
    scalar_mappable = cm.ScalarMappable(norm=norm, cmap=cmap)

    # Apply the Draine-Li attenuation to the shared reprocessed spectrum for
    # each sampled line-of-sight column-density setup.
    attenuated_spectra = []
    for index, (hydrogen_column, dtg) in enumerate(
        zip(hydrogen_columns, dust_to_gas_ratios)
    ):
        dust_component_kwargs = {
            component_name: dust_component_columns[component_name][index]
            for component_name in dust_component_columns
        }
        attenuated_sed = reprocessed_sed.apply_attenuation(
            dust_curve=draine_li,
            sigmalos_H=hydrogen_column,
            **dust_component_kwargs,
        )
        attenuated_spectra.append(attenuated_sed)

        color = cmap(norm(dtg))

        # Plot the Draine-Li attenuated spectrum for this DTG setup.
        spec_ax.loglog(
            attenuated_sed.lam,
            attenuated_sed.lnu,
            color=color,
            lw=1.2,
            ls="-",
            alpha=0.45,
            zorder=10,
        )

    # Add the unattenuated reprocessed spectrum on top so it remains easy
    # to compare against the attenuated family.
    spec_ax.loglog(
        reprocessed_sed.lam,
        reprocessed_sed.lnu,
        color="black",
        lw=3.4,
        ls=":",
        zorder=30,
    )

    # Format the spectra panel.
    x_min = PLOT_X_LIMITS[0].value
    x_max = PLOT_X_LIMITS[1].value
    spec_ax.set_xlim(x_min, x_max)
    visible_mask = (reprocessed_sed.lam.value >= x_min) & (
        reprocessed_sed.lam.value <= x_max
    )
    visible_unattenuated = reprocessed_sed.lnu.value[visible_mask]
    spec_ax.set_ylim(PLOT_Y_MIN, visible_unattenuated.max() * 1.2)
    spec_ax.set_xlabel(r"$\lambda\,/\,\AA$")
    spec_ax.set_ylabel(r"$L_{\nu}\,/\,\mathrm{erg\ s^{-1}\ Hz^{-1}}$")
    spec_ax.grid(True, which="major", alpha=0.2)

    colorbar = fig.colorbar(
        scalar_mappable,
        ax=spec_ax,
        pad=0.02,
    )
    colorbar.set_label("Dust-to-gas ratio")

    spec_ax.legend(
        handles=[
            Line2D([0], [0], color="black", lw=3.4, ls=":"),
            Line2D([0], [0], color="black", lw=2.0, ls="-"),
        ],
        labels=[
            "Unattenuated reprocessed",
            "Draine-Li",
        ],
        loc="best",
        frameon=False,
        fontsize=9,
    )
    fig.subplots_adjust(
        left=0.11,
        right=0.9,
        bottom=0.12,
        top=0.95,
    )
    plt.show()


if __name__ == "__main__":
    main()
Total running time of the script: (0 minutes 1.013 seconds)