Note
Go to the end to download the full example code.
Smoothed LOS Kernel Overlap Geometries
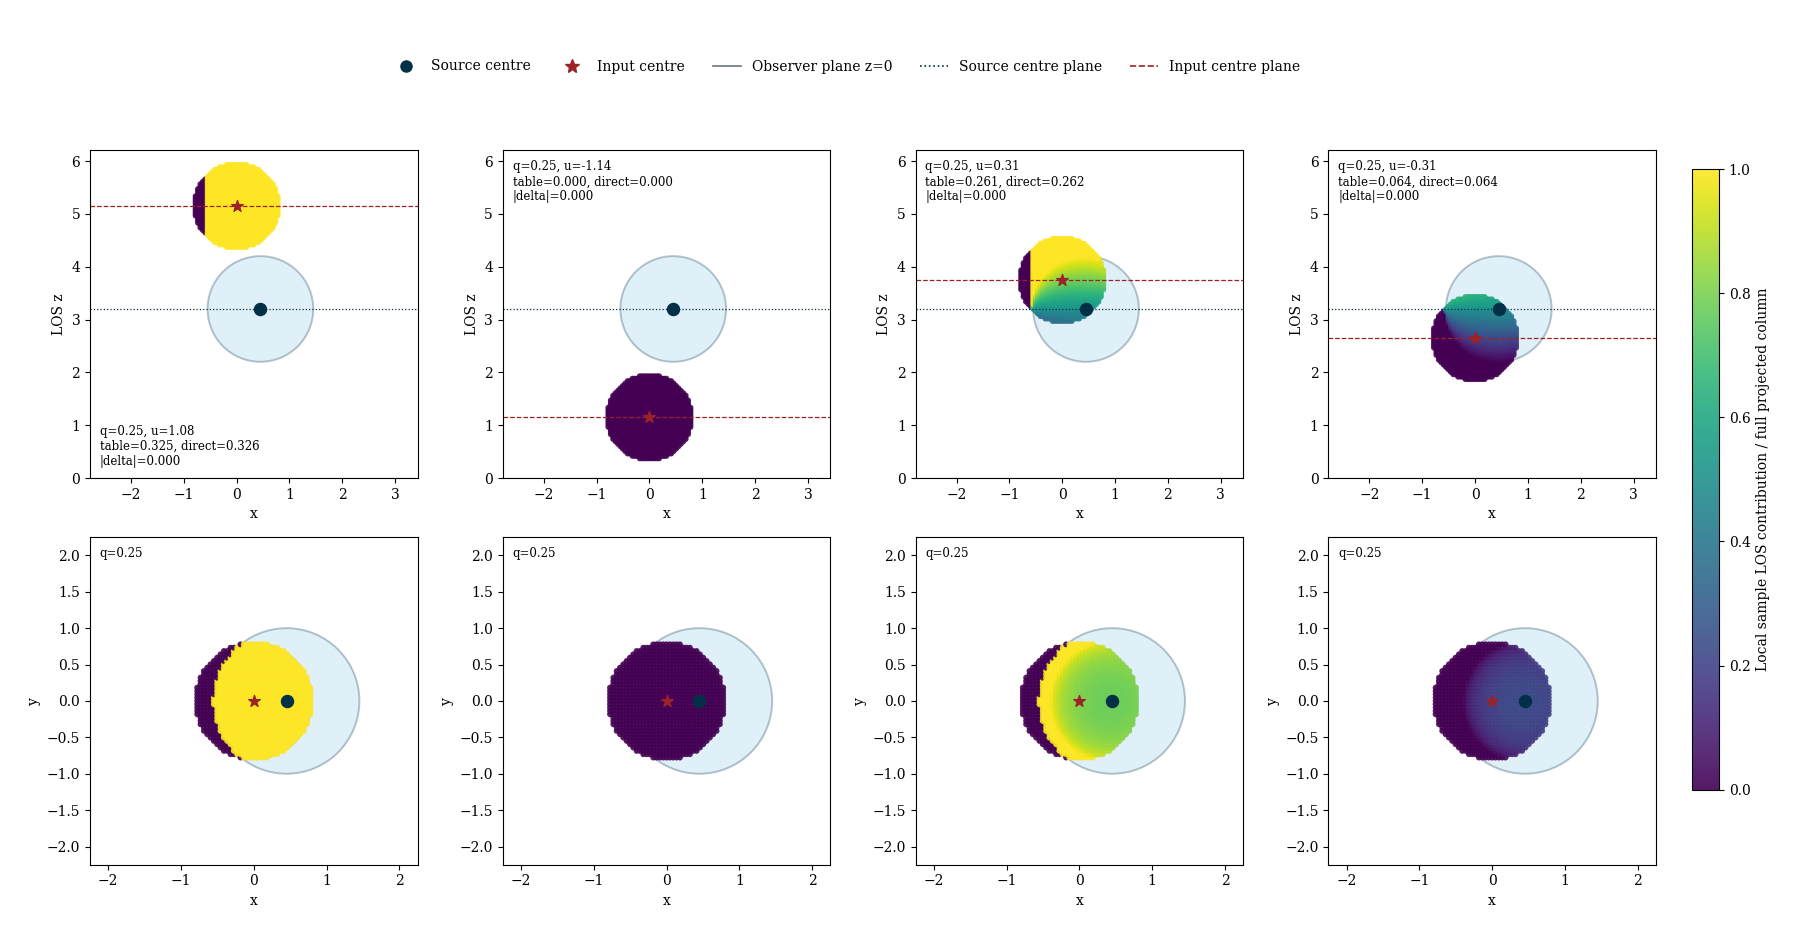
This example visualises the source/input geometries handled by the smoothed line-of-sight kernel overlap look-up table.
The key point is that the overlap table tabulates the kernel-averaged source contribution in terms of the normalized pair coordinates
q = b / (R_i + R_j)u = (z_i - z_j) / (R_i + R_j)eta = h_i / h_j
where R = threshold * h is the support radius used by the LOS solver.
The four panels below correspond to four physically distinct source/input arrangements:
the input support lies wholly in front of the source support,
the input support lies wholly behind the source support,
the source and input supports overlap in z with the source centre in front,
the source and input supports overlap in z with the source centre behind.
Within each panel, sample points inside the input kernel are coloured by the
fraction of the full source LOS column they see. The observer is always at
z=0 in these examples, so the z-axis is anchored there while the gas/source
kernel stays fixed and the input centre moves through the four cases.
import matplotlib.pyplot as plt
import numpy as np
from matplotlib.colors import Normalize
from matplotlib.lines import Line2D
from matplotlib.patches import Circle
from synthesizer.kernel_functions import Kernel
plt.rcParams["font.family"] = "DejaVu Serif"
plt.rcParams["font.serif"] = ["Times New Roman"]
THRESHOLD = 1.0
SOURCE_KERNEL = "uniform"
SOURCE_H = 1.0
INPUT_H = 0.8
SAMPLE_NDIM = 35
SOURCE_SUPPORT = THRESHOLD * SOURCE_H
INPUT_SUPPORT = THRESHOLD * INPUT_H
KERNEL = Kernel(name=SOURCE_KERNEL, binsize=256)
TRUNCATED_KERNEL, TRUNC_Q_GRID, TRUNC_Z_GRID = (
KERNEL.get_truncated_los_kernel()
)
FULL_KERNEL = KERNEL.get_kernel()
OVERLAP_KERNEL, OVERLAP_Q_GRID, OVERLAP_U_GRID, OVERLAP_ETA_GRID = (
KERNEL.get_overlap_kernel()
)
def get_kernel_value(table, q):
"""Linearly interpolate a 1D kernel table on ``[0, 1]``."""
if q < 0.0 or q >= 1.0:
return 0.0
return np.interp(q, np.linspace(0.0, 1.0, table.size), table)
def get_truncated_value(table, q_grid, z_grid, q, z):
"""Bilinearly interpolate the truncated LOS kernel table."""
if q < 0.0 or q >= 1.0:
return 0.0
z = np.clip(z, z_grid[0], z_grid[-1])
iq = np.searchsorted(q_grid, q, side="right") - 1
iz = np.searchsorted(z_grid, z, side="right") - 1
iq = np.clip(iq, 0, q_grid.size - 2)
iz = np.clip(iz, 0, z_grid.size - 2)
q0 = q_grid[iq]
q1 = q_grid[iq + 1]
z0 = z_grid[iz]
z1 = z_grid[iz + 1]
qfrac = 0.0 if q1 == q0 else (q - q0) / (q1 - q0)
zfrac = 0.0 if z1 == z0 else (z - z0) / (z1 - z0)
v00 = table[iq, iz]
v01 = table[iq, iz + 1]
v10 = table[iq + 1, iz]
v11 = table[iq + 1, iz + 1]
vz0 = v00 + zfrac * (v01 - v00)
vz1 = v10 + zfrac * (v11 - v10)
return vz0 + qfrac * (vz1 - vz0)
def get_overlap_value(table, q_grid, u_grid, eta_grid, q, u, eta):
"""Trilinearly interpolate the overlap look-up table."""
if q < 0.0 or q >= 1.0:
return 0.0
if u <= -1.0:
return 0.0
u = min(u, 1.0)
eta = np.clip(eta, eta_grid[0], eta_grid[-1])
iq = np.searchsorted(q_grid, q, side="right") - 1
iu = np.searchsorted(u_grid, u, side="right") - 1
ie = np.searchsorted(eta_grid, eta, side="right") - 1
iq = np.clip(iq, 0, q_grid.size - 2)
iu = np.clip(iu, 0, u_grid.size - 2)
ie = np.clip(ie, 0, eta_grid.size - 2)
q0 = q_grid[iq]
q1 = q_grid[iq + 1]
u0 = u_grid[iu]
u1 = u_grid[iu + 1]
e0 = eta_grid[ie]
e1 = eta_grid[ie + 1]
qf = 0.0 if q1 == q0 else (q - q0) / (q1 - q0)
uf = 0.0 if u1 == u0 else (u - u0) / (u1 - u0)
ef = 0.0 if e1 == e0 else (np.log(eta) - np.log(e0)) / np.log(e1 / e0)
block = table[iq : iq + 2, iu : iu + 2, ie : ie + 2]
c00 = block[0, 0, 0] + ef * (block[0, 0, 1] - block[0, 0, 0])
c01 = block[0, 1, 0] + ef * (block[0, 1, 1] - block[0, 1, 0])
c10 = block[1, 0, 0] + ef * (block[1, 0, 1] - block[1, 0, 0])
c11 = block[1, 1, 0] + ef * (block[1, 1, 1] - block[1, 1, 0])
cu0 = c00 + uf * (c01 - c00)
cu1 = c10 + uf * (c11 - c10)
return cu0 + qf * (cu1 - cu0)
def make_input_samples(ndim=SAMPLE_NDIM):
"""Build a regular set of points inside the input support sphere."""
mids = np.linspace(-1.0 + 1.0 / ndim, 1.0 - 1.0 / ndim, ndim)
qx, qy, qz = np.meshgrid(mids, mids, mids, indexing="ij")
radius2 = qx * qx + qy * qy + qz * qz
mask = radius2 < 1.0
return qx[mask], qy[mask], qz[mask]
def classify_sample(z_sample, z_source, source_support):
"""Classify one input sample relative to the source support in z."""
if z_source + source_support <= z_sample:
return "full"
if z_source - source_support >= z_sample:
return "none"
return "truncated"
def compute_sample_fraction(source_pos, input_pos, qx, qy, qz):
"""Compute local sample-point LOS fractions across the input support."""
x = input_pos[0] + INPUT_SUPPORT * qx
y = input_pos[1] + INPUT_SUPPORT * qy
z = input_pos[2] + INPUT_SUPPORT * qz
dx = source_pos[0] - x
dy = source_pos[1] - y
impact = np.sqrt(dx * dx + dy * dy)
q_source = impact / SOURCE_SUPPORT
full_column = np.array(
[get_kernel_value(FULL_KERNEL, value) for value in q_source],
dtype=np.float64,
)
truncated = np.array(
[
get_truncated_value(
TRUNCATED_KERNEL,
TRUNC_Q_GRID,
TRUNC_Z_GRID,
q_val,
(z_val - source_pos[2]) / SOURCE_SUPPORT,
)
for q_val, z_val in zip(q_source, z, strict=False)
],
dtype=np.float64,
)
contribution = np.zeros_like(full_column)
regimes = np.empty(full_column.size, dtype=object)
for i, z_sample in enumerate(z):
regime = classify_sample(z_sample, source_pos[2], SOURCE_SUPPORT)
regimes[i] = regime
if regime == "full":
contribution[i] = full_column[i]
elif regime == "truncated":
contribution[i] = truncated[i]
fraction = np.divide(
contribution,
full_column,
out=np.zeros_like(contribution),
where=full_column > 0.0,
)
return x, y, z, contribution, full_column, fraction, regimes
def xz_position(x, z):
"""Create a 3D position with zero y for x-z plots."""
return np.array([x, 0.0, z], dtype=np.float64)
def weighted_overlap_average(qx, qy, qz, values):
"""Compute a kernel-weighted average over the input support."""
radius = np.sqrt(qx * qx + qy * qy + qz * qz)
weights = KERNEL.f(radius)
return np.sum(weights * values) / np.sum(weights)
def get_slice_mask(qcoord, ndim=SAMPLE_NDIM):
"""Select one cell-centred slice through the regular sample grid."""
return np.isclose(qcoord, 0.0, atol=0.5 / ndim)
def get_case_diagnostics(source_pos, input_pos, qx, qy, qz):
"""Compute the diagnostics shared between the x-z and x-y views."""
x, y, z, contribution, full_column, fraction, regimes = (
compute_sample_fraction(source_pos, input_pos, qx, qy, qz)
)
radius = np.sqrt(qx * qx + qy * qy + qz * qz)
weights = KERNEL.f(radius)
weight_sum = np.sum(weights)
projected_sep = np.hypot(
source_pos[0] - input_pos[0], source_pos[1] - input_pos[1]
)
support_sum = SOURCE_SUPPORT + INPUT_SUPPORT
q_pair = projected_sep / support_sum
u_pair = (input_pos[2] - source_pos[2]) / support_sum
eta = INPUT_H / SOURCE_H
table_fraction = get_overlap_value(
OVERLAP_KERNEL,
OVERLAP_Q_GRID,
OVERLAP_U_GRID,
OVERLAP_ETA_GRID,
q_pair,
u_pair,
eta,
)
sampled_fraction = weighted_overlap_average(qx, qy, qz, fraction)
sampled_absolute = weighted_overlap_average(qx, qy, qz, contribution)
full_absolute = weighted_overlap_average(qx, qy, qz, full_column)
direct_full_component = weighted_overlap_average(
qx,
qy,
qz,
np.where(regimes == "full", contribution, 0.0),
)
direct_truncated_component = weighted_overlap_average(
qx,
qy,
qz,
np.where(regimes == "truncated", contribution, 0.0),
)
full_count = np.count_nonzero(regimes == "full")
trunc_count = np.count_nonzero(regimes == "truncated")
none_count = np.count_nonzero(regimes == "none")
full_weight = np.sum(weights[regimes == "full"]) / weight_sum
trunc_weight = np.sum(weights[regimes == "truncated"]) / weight_sum
none_weight = np.sum(weights[regimes == "none"]) / weight_sum
zx_slice = get_slice_mask(qy)
yx_slice = get_slice_mask(qz)
return {
"x": x,
"y": y,
"z": z,
"contribution": contribution,
"full_column": full_column,
"fraction": fraction,
"regimes": regimes,
"q": q_pair,
"u": u_pair,
"eta": eta,
"table": table_fraction,
"sampled": sampled_fraction,
"sampled_absolute": sampled_absolute,
"full_absolute": full_absolute,
"direct_full_component": direct_full_component,
"direct_truncated_component": direct_truncated_component,
"full": full_count,
"truncated": trunc_count,
"none": none_count,
"full_weight": full_weight,
"truncated_weight": trunc_weight,
"none_weight": none_weight,
"zx_slice": zx_slice,
"yx_slice": yx_slice,
}
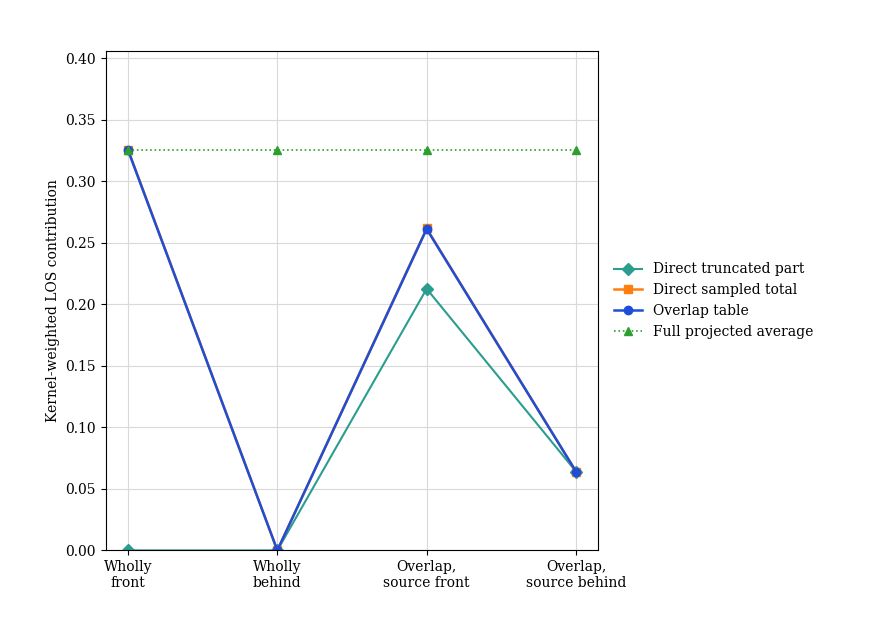
def plot_correctness_checks(cases, case_diagnostics):
"""Plot the direct reference and overlap table on one panel."""
labels = [
"Wholly\nfront",
"Wholly\nbehind",
"Overlap,\nsource front",
"Overlap,\nsource behind",
]
x = np.arange(len(labels))
fig, ax = plt.subplots(figsize=(8.8, 6.4))
table_values = np.array([diag["table"] for diag in case_diagnostics])
sampled_values = np.array(
[diag["sampled_absolute"] for diag in case_diagnostics]
)
full_values = np.array(
[diag["full_absolute"] for diag in case_diagnostics]
)
truncated_components = np.array(
[diag["direct_truncated_component"] for diag in case_diagnostics]
)
ax.plot(
x,
truncated_components,
marker="D",
lw=1.5,
color="#2a9d8f",
label="Direct truncated part",
)
ax.plot(
x,
sampled_values,
marker="s",
lw=1.8,
color="#ff7f0e",
label="Direct sampled total",
)
ax.plot(
x,
table_values,
marker="o",
lw=1.8,
color="#1d4ed8",
label="Overlap table",
)
ax.plot(
x,
full_values,
marker="^",
lw=1.2,
ls=":",
color="#2ca02c",
label="Full projected average",
)
ax.set_xticks(x, labels)
ax.set_ylim(0.0, max(np.max(sampled_values), np.max(full_values)) + 0.08)
ax.set_ylabel("Kernel-weighted LOS contribution")
ax.grid(True, color="0.85", lw=0.8)
ax.set_axisbelow(True)
ax.legend(
frameon=False,
loc="center left",
bbox_to_anchor=(1.02, 0.5),
borderaxespad=0.0,
)
fig.subplots_adjust(left=0.12, right=0.68, bottom=0.14, top=0.92)
return fig
def format_zx_annotation(diagnostics):
"""Format the z-x panel annotation text."""
table_value = diagnostics["table"]
direct_value = diagnostics["sampled_absolute"]
delta = abs(table_value - direct_value)
return (
f"q={diagnostics['q']:.2f}, u={diagnostics['u']:.2f}\n"
f"table={table_value:.3f}, direct={direct_value:.3f}\n"
f"|delta|={delta:.3f}"
)
def plot_zx_panel(
ax,
title,
source_pos,
input_pos,
diagnostics,
cmap,
norm,
text_xy=(0.03, 0.97),
text_va="top",
text_ha="left",
):
"""Plot one overlap geometry panel with z vertical and x horizontal."""
slice_mask = diagnostics["zx_slice"]
x = diagnostics["x"][slice_mask]
z = diagnostics["z"][slice_mask]
fraction = diagnostics["fraction"][slice_mask]
ax.add_patch(
Circle(
(source_pos[0], source_pos[2]),
SOURCE_SUPPORT,
facecolor="#8ecae6",
edgecolor="#023047",
alpha=0.28,
lw=1.4,
)
)
ax.add_patch(
Circle(
(input_pos[0], input_pos[2]),
INPUT_SUPPORT,
facecolor="#ffb703",
edgecolor="#9b2226",
alpha=0.18,
lw=1.4,
)
)
sc = ax.scatter(
x,
z,
c=fraction,
cmap=cmap,
norm=norm,
s=18,
alpha=0.9,
linewidths=0.0,
)
ax.scatter(
[source_pos[0]],
[source_pos[2]],
color="#023047",
s=75,
marker="o",
zorder=5,
)
ax.scatter(
[input_pos[0]],
[input_pos[2]],
color="#9b2226",
s=75,
marker="*",
zorder=6,
)
ax.axhline(source_pos[2], color="#023047", lw=0.9, ls=":")
ax.axhline(input_pos[2], color="#9b2226", lw=0.9, ls="--")
ax.axhline(0.0, color="#6c757d", lw=0.8, ls="-", alpha=0.7)
ax.text(
text_xy[0],
text_xy[1],
format_zx_annotation(diagnostics),
transform=ax.transAxes,
va=text_va,
ha=text_ha,
fontsize=8.5,
bbox={"facecolor": "white", "alpha": 0.82, "edgecolor": "none"},
)
ax.set_aspect("equal")
ax.set_xlabel("x")
ax.set_ylabel("LOS z")
return sc
def plot_yx_panel(ax, source_pos, input_pos, diagnostics, cmap, norm):
"""Plot the same case with y vertical and x horizontal."""
slice_mask = diagnostics["yx_slice"]
x = diagnostics["x"][slice_mask]
y = diagnostics["y"][slice_mask]
fraction = diagnostics["fraction"][slice_mask]
ax.add_patch(
Circle(
(source_pos[0], source_pos[1]),
SOURCE_SUPPORT,
facecolor="#8ecae6",
edgecolor="#023047",
alpha=0.28,
lw=1.4,
)
)
ax.add_patch(
Circle(
(input_pos[0], input_pos[1]),
INPUT_SUPPORT,
facecolor="#ffb703",
edgecolor="#9b2226",
alpha=0.18,
lw=1.4,
)
)
sc = ax.scatter(
x,
y,
c=fraction,
cmap=cmap,
norm=norm,
s=18,
alpha=0.9,
linewidths=0.0,
)
ax.scatter(
[source_pos[0]],
[source_pos[1]],
color="#023047",
s=75,
marker="o",
zorder=5,
)
ax.scatter(
[input_pos[0]],
[input_pos[1]],
color="#9b2226",
s=75,
marker="*",
zorder=6,
)
ax.text(
0.03,
0.97,
f"q={diagnostics['q']:.2f}",
transform=ax.transAxes,
va="top",
ha="left",
fontsize=8.5,
bbox={"facecolor": "white", "alpha": 0.82, "edgecolor": "none"},
)
ax.set_aspect("equal")
ax.set_xlim(-2.25, 2.25)
ax.set_ylim(-2.25, 2.25)
ax.set_xlabel("x")
ax.set_ylabel("y")
return sc
sample_qx, sample_qy, sample_qz = make_input_samples()
SOURCE_CENTRE = xz_position(0.45, 3.2)
cases = [
(
"Input wholly in front",
SOURCE_CENTRE,
xz_position(0.0, 5.15),
),
(
"Input wholly behind",
SOURCE_CENTRE,
xz_position(0.0, 1.15),
),
(
"z overlap, source in front",
SOURCE_CENTRE,
xz_position(0.0, 3.75),
),
(
"z overlap, source behind",
SOURCE_CENTRE,
xz_position(0.0, 2.65),
),
]
top_xmin = min(
min(source_pos[0] - SOURCE_SUPPORT, input_pos[0] - INPUT_SUPPORT)
for _, source_pos, input_pos in cases
)
top_xmax = max(
max(source_pos[0] + SOURCE_SUPPORT, input_pos[0] + INPUT_SUPPORT)
for _, source_pos, input_pos in cases
)
top_zmax = max(
max(source_pos[2] + SOURCE_SUPPORT, input_pos[2] + INPUT_SUPPORT)
for _, source_pos, input_pos in cases
)
TOP_XPAD = 0.25
TOP_ZPAD = 0.25
top_zmin = 0.0
top_zmax_padded = top_zmax + TOP_ZPAD
top_height = top_zmax_padded - top_zmin
top_xcentre = 0.5 * (top_xmin + top_xmax)
top_half_width = 0.5 * top_height
top_xmin_square = top_xcentre - top_half_width
top_xmax_square = top_xcentre + top_half_width
fig, axes = plt.subplots(2, 4, figsize=(18, 9.4))
cmap = plt.get_cmap("viridis")
norm = Normalize(vmin=0.0, vmax=1.0)
all_diagnostics = []
for col, (title, source_pos, input_pos) in enumerate(cases):
diagnostics = get_case_diagnostics(
source_pos,
input_pos,
sample_qx,
sample_qy,
sample_qz,
)
all_diagnostics.append(diagnostics)
sc = plot_zx_panel(
axes[0, col],
title,
source_pos,
input_pos,
diagnostics,
cmap,
norm,
text_xy=(0.03, 0.03) if col == 0 else (0.03, 0.97),
text_va="bottom" if col == 0 else "top",
text_ha="left",
)
axes[0, col].set_xlim(top_xmin_square, top_xmax_square)
axes[0, col].set_ylim(top_zmin, top_zmax_padded)
plot_yx_panel(
axes[1, col],
source_pos,
input_pos,
diagnostics,
cmap,
norm,
)
legend_handles = [
Line2D(
[0],
[0],
marker="o",
color="none",
markerfacecolor="#023047",
markeredgecolor="#023047",
markersize=8,
label="Source centre",
),
Line2D(
[0],
[0],
marker="*",
color="none",
markerfacecolor="#9b2226",
markeredgecolor="#9b2226",
markersize=10,
label="Input centre",
),
Line2D(
[0],
[0],
color="#6c757d",
lw=1.2,
ls="-",
label="Observer plane z=0",
),
Line2D(
[0],
[0],
color="#023047",
lw=1.2,
ls=":",
label="Source centre plane",
),
Line2D(
[0],
[0],
color="#9b2226",
lw=1.2,
ls="--",
label="Input centre plane",
),
]
fig.legend(
handles=legend_handles,
loc="upper center",
ncol=5,
frameon=False,
bbox_to_anchor=(0.47, 0.95),
fontsize=10,
)
cax = fig.add_axes([0.94, 0.16, 0.015, 0.66])
cbar = fig.colorbar(sc, cax=cax)
cbar.set_label("Local sample LOS contribution / full projected column")
fig.subplots_adjust(
left=0.05,
right=0.92,
bottom=0.08,
top=0.84,
wspace=0.26,
hspace=0.18,
)
check_fig = plot_correctness_checks(cases, all_diagnostics)
plt.show()
Total running time of the script: (0 minutes 7.027 seconds)