Particle and Wavelength Scaling
These benchmarks show how individual operations scale with problem size (number of particles or wavelength elements). These tests isolate specific operations to understand their computational complexity.
All tests were run using 32 threads on AMD EPYC 7542 32-Core Processor hardware.
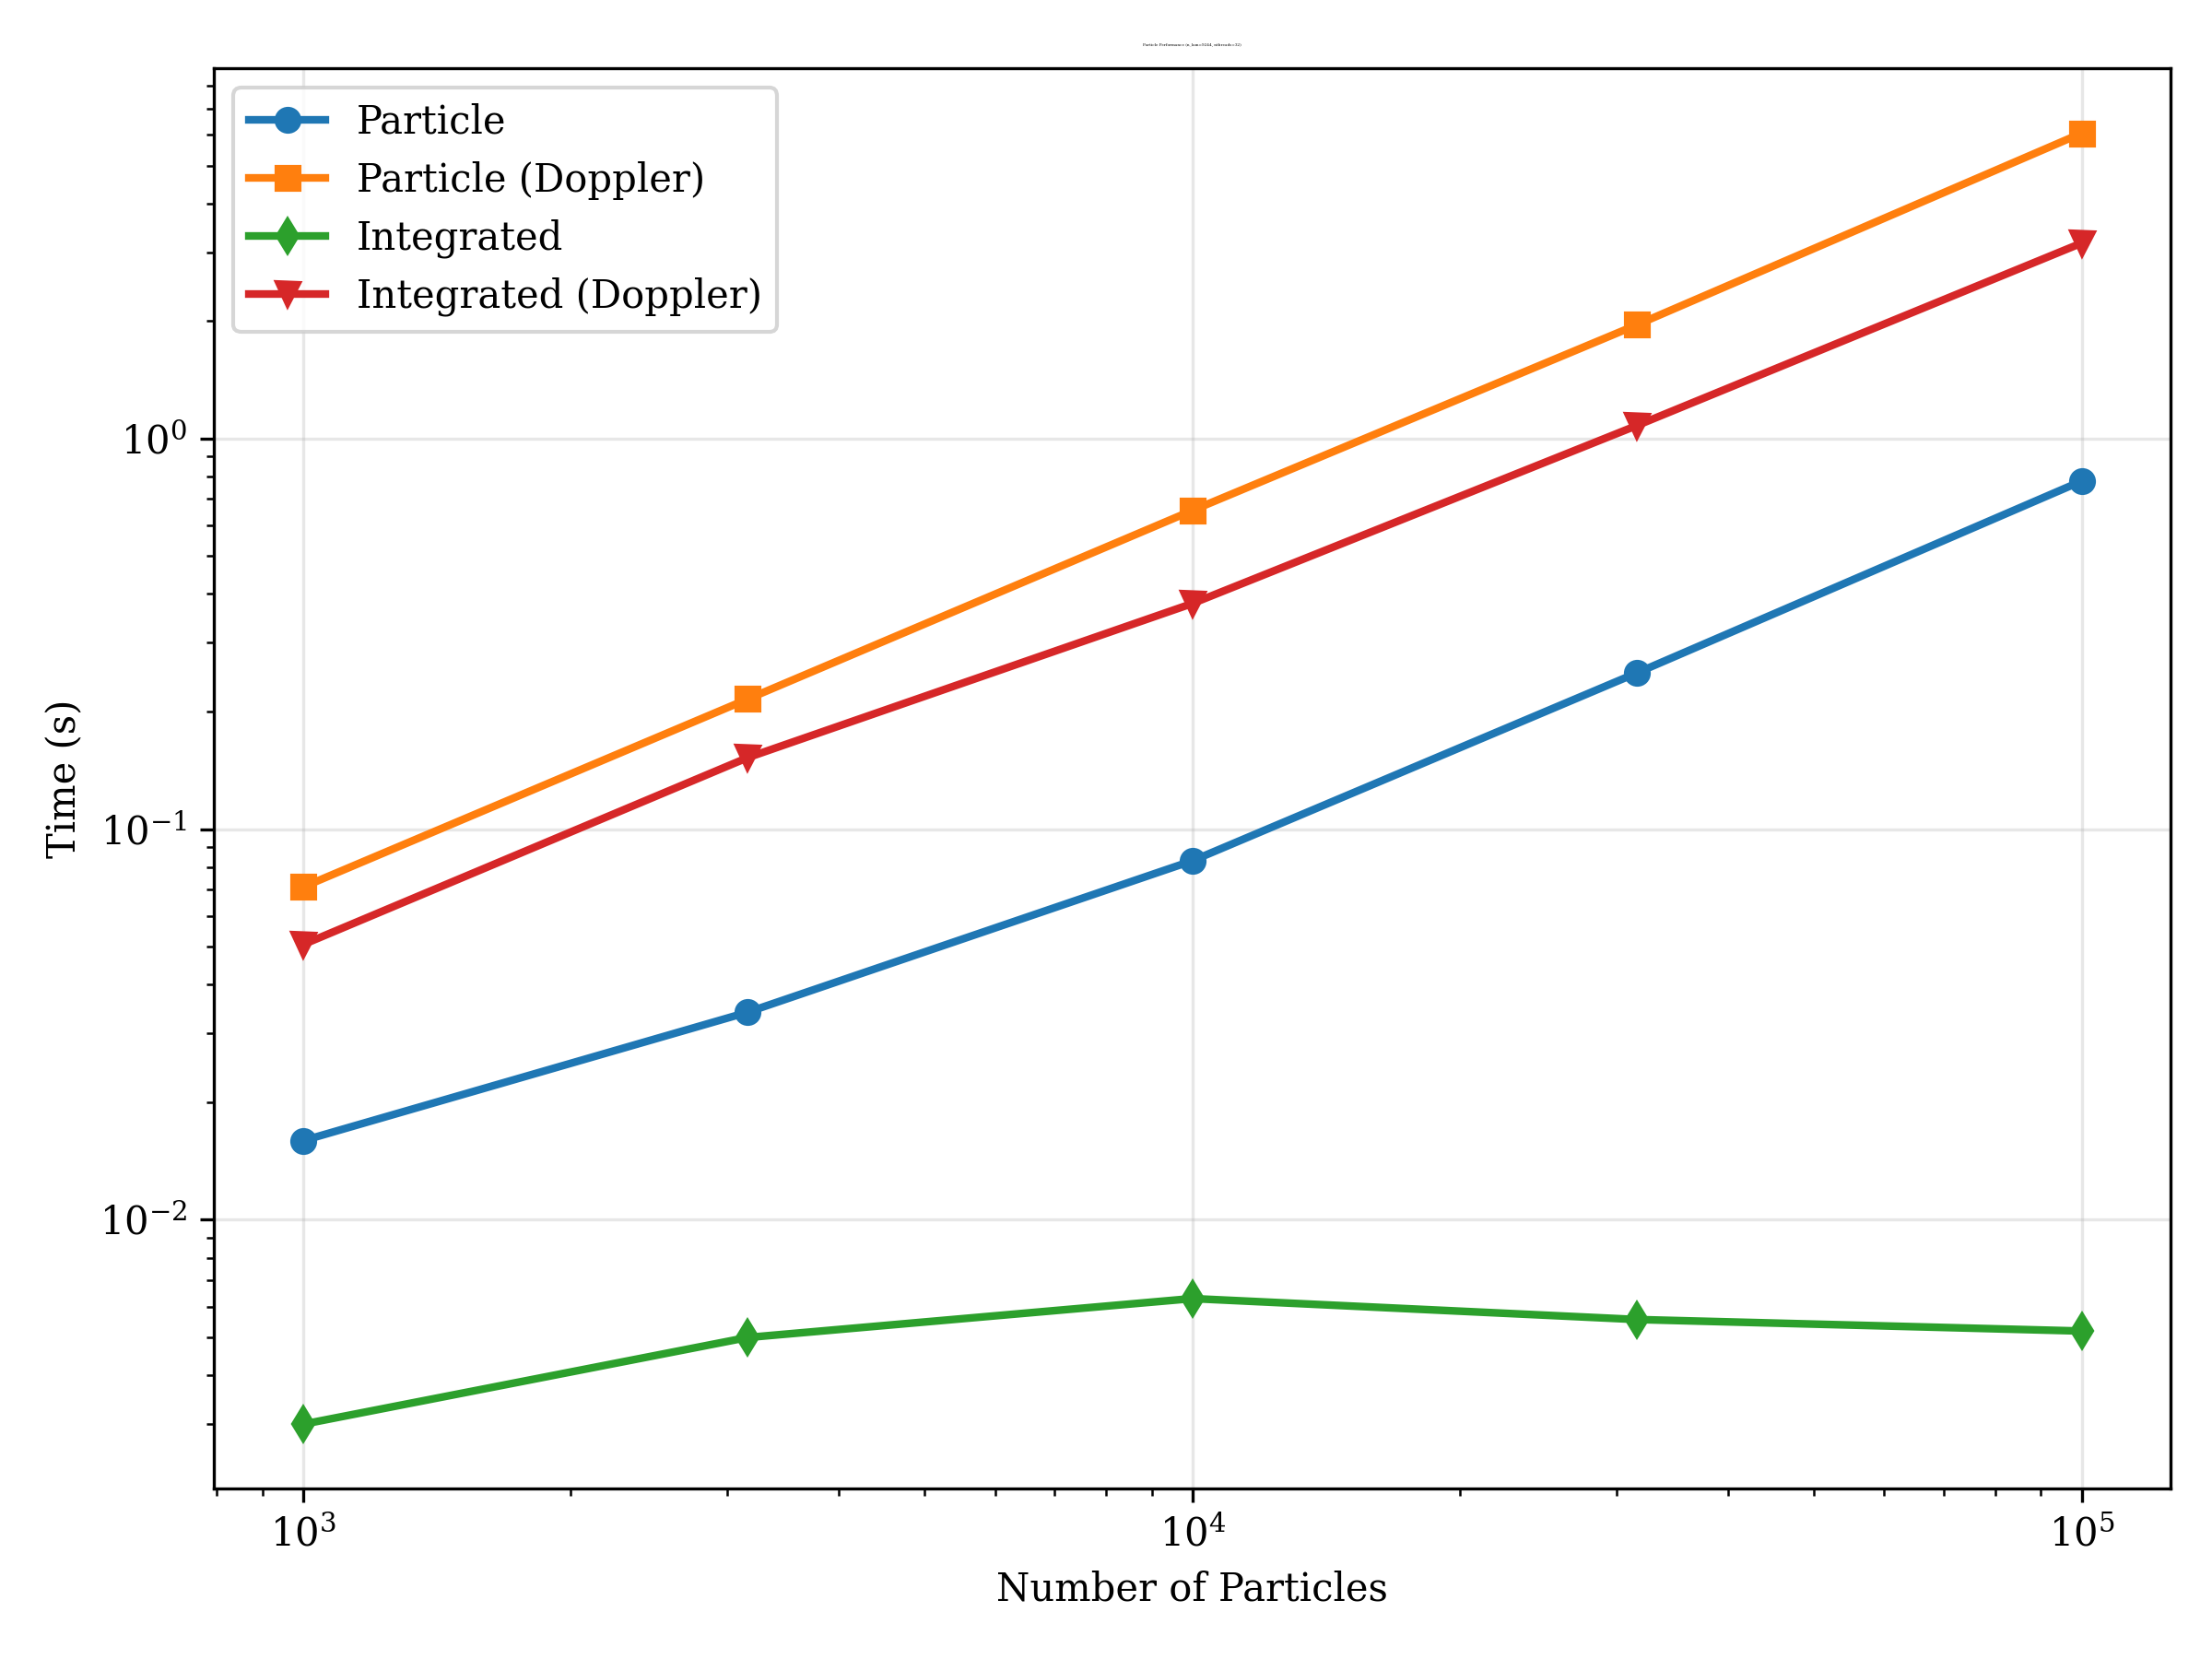
Particle Scaling
The following plots show how the runtime of individual operations scales with the number of stellar particles (from 10³ to 10⁵). These tests were run using a grid with 9244 wavelength elements.
Spectra Generation
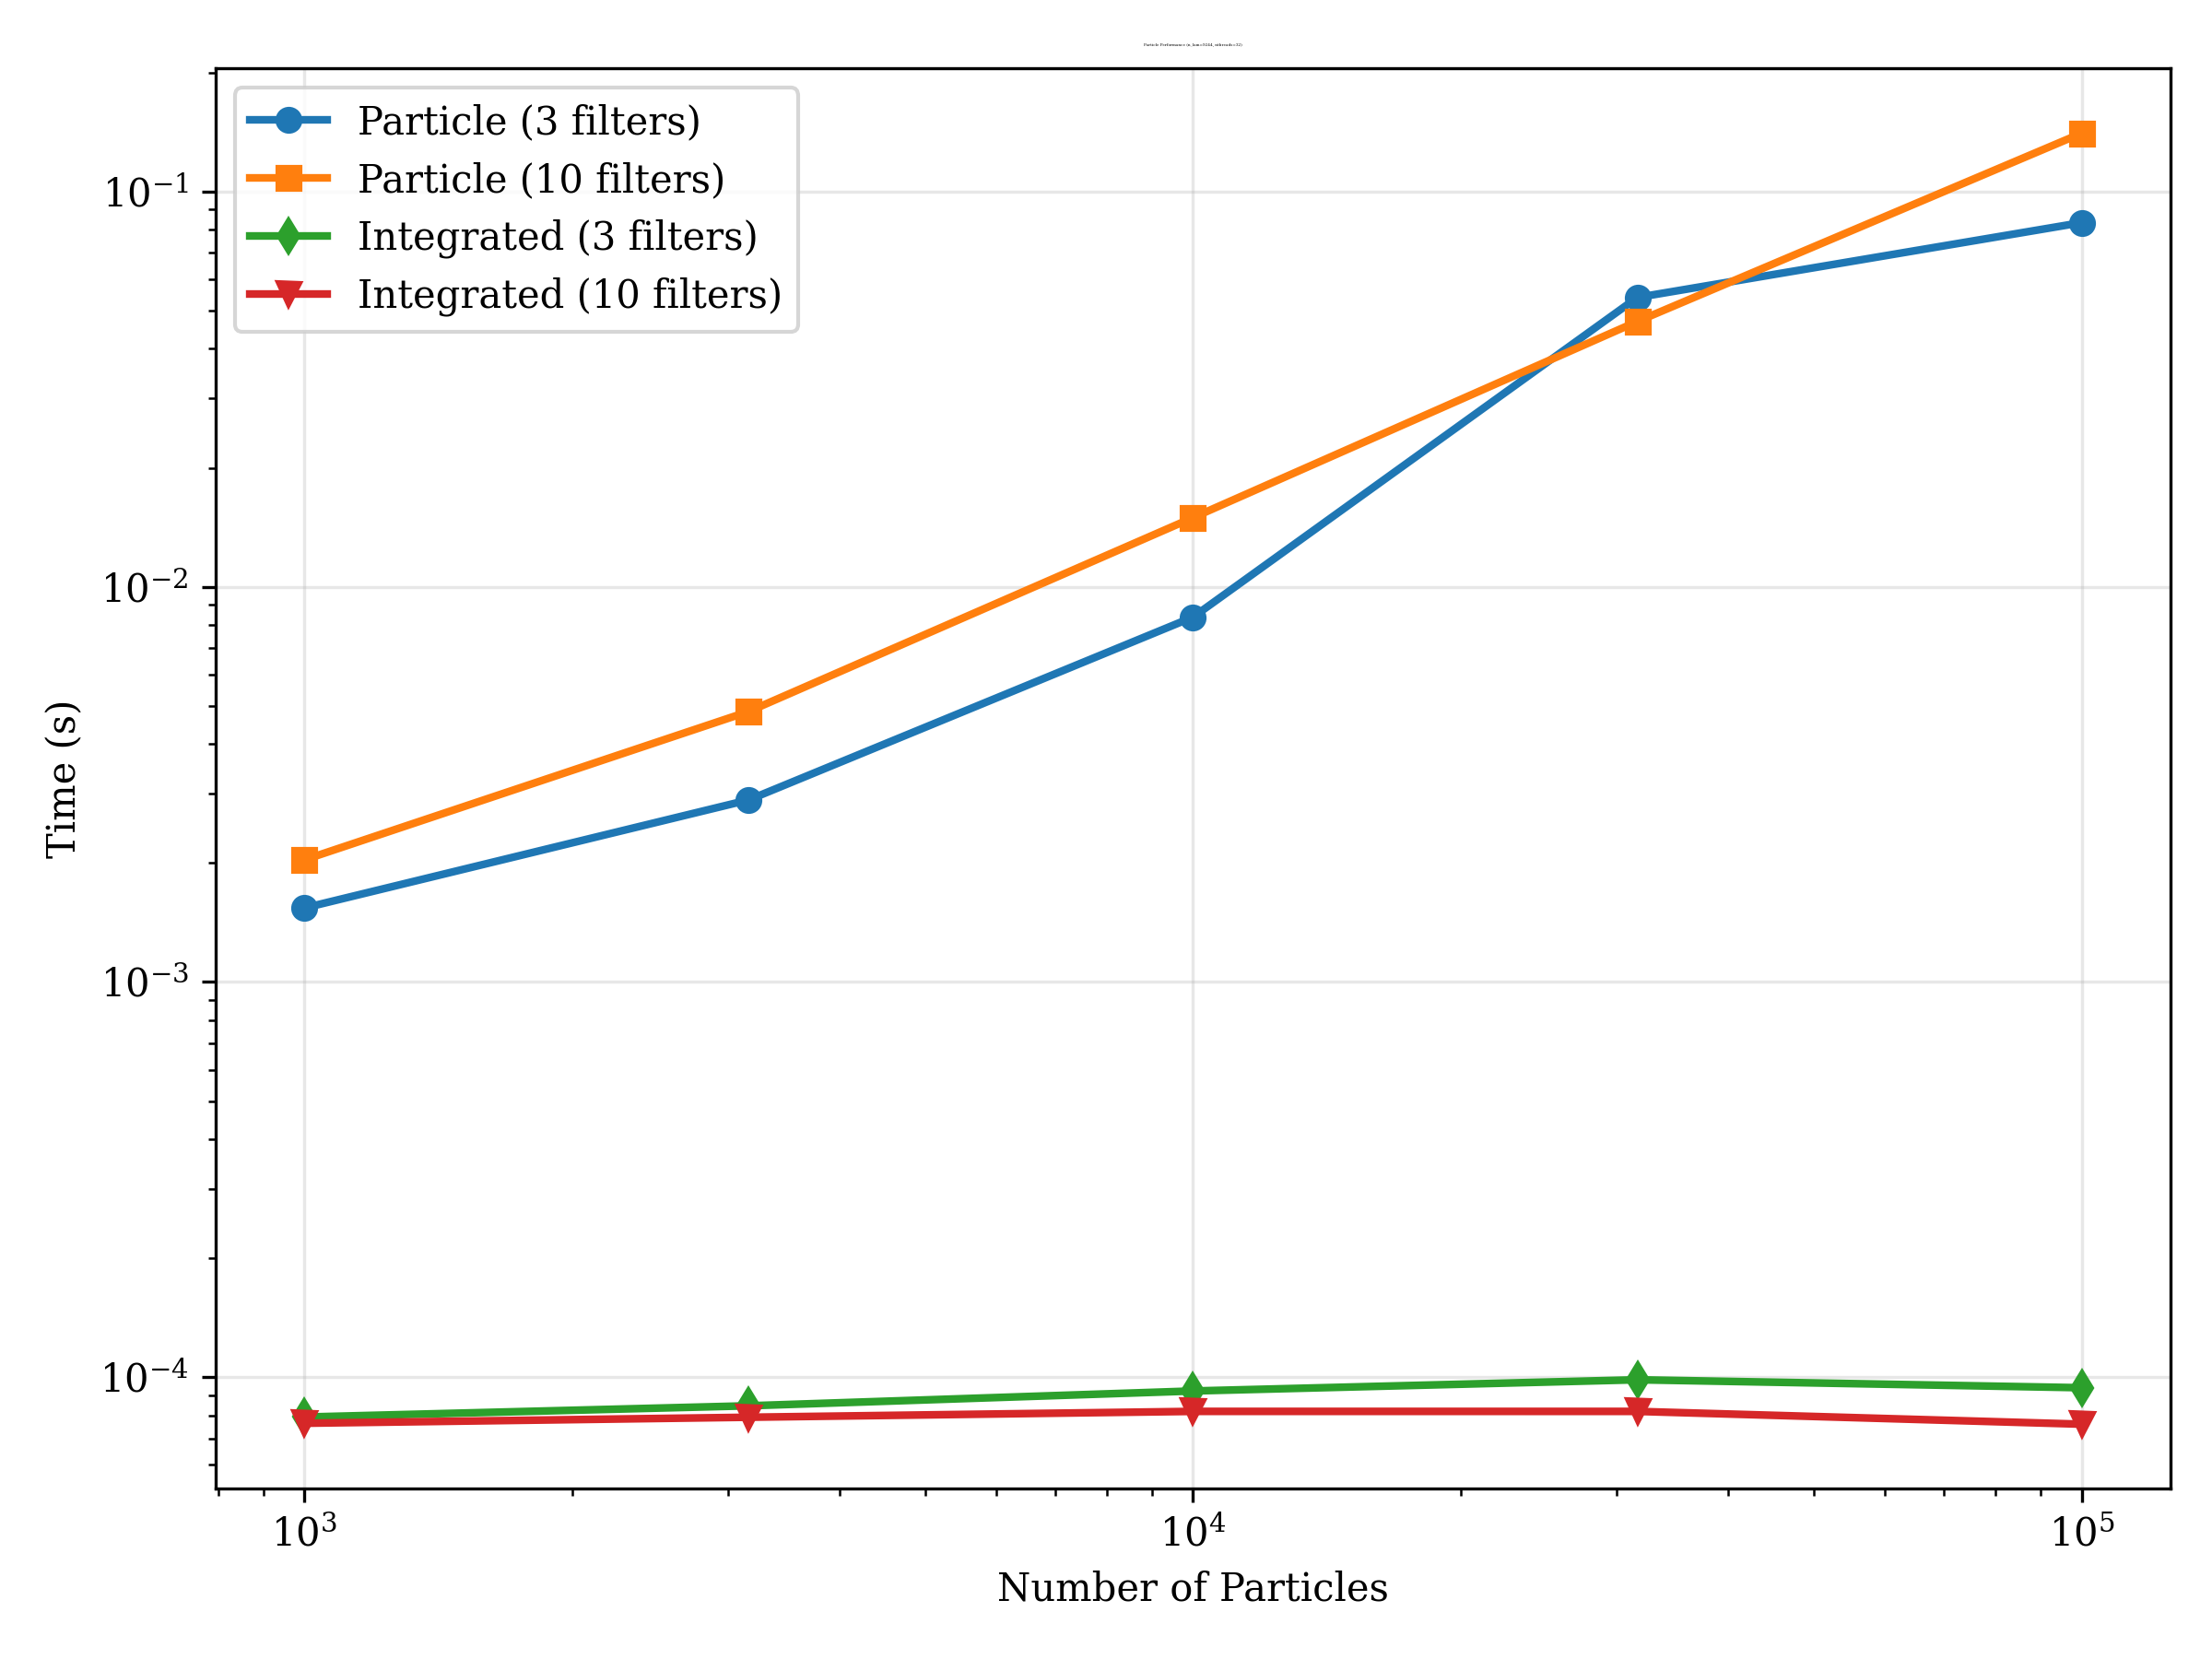
Photometry
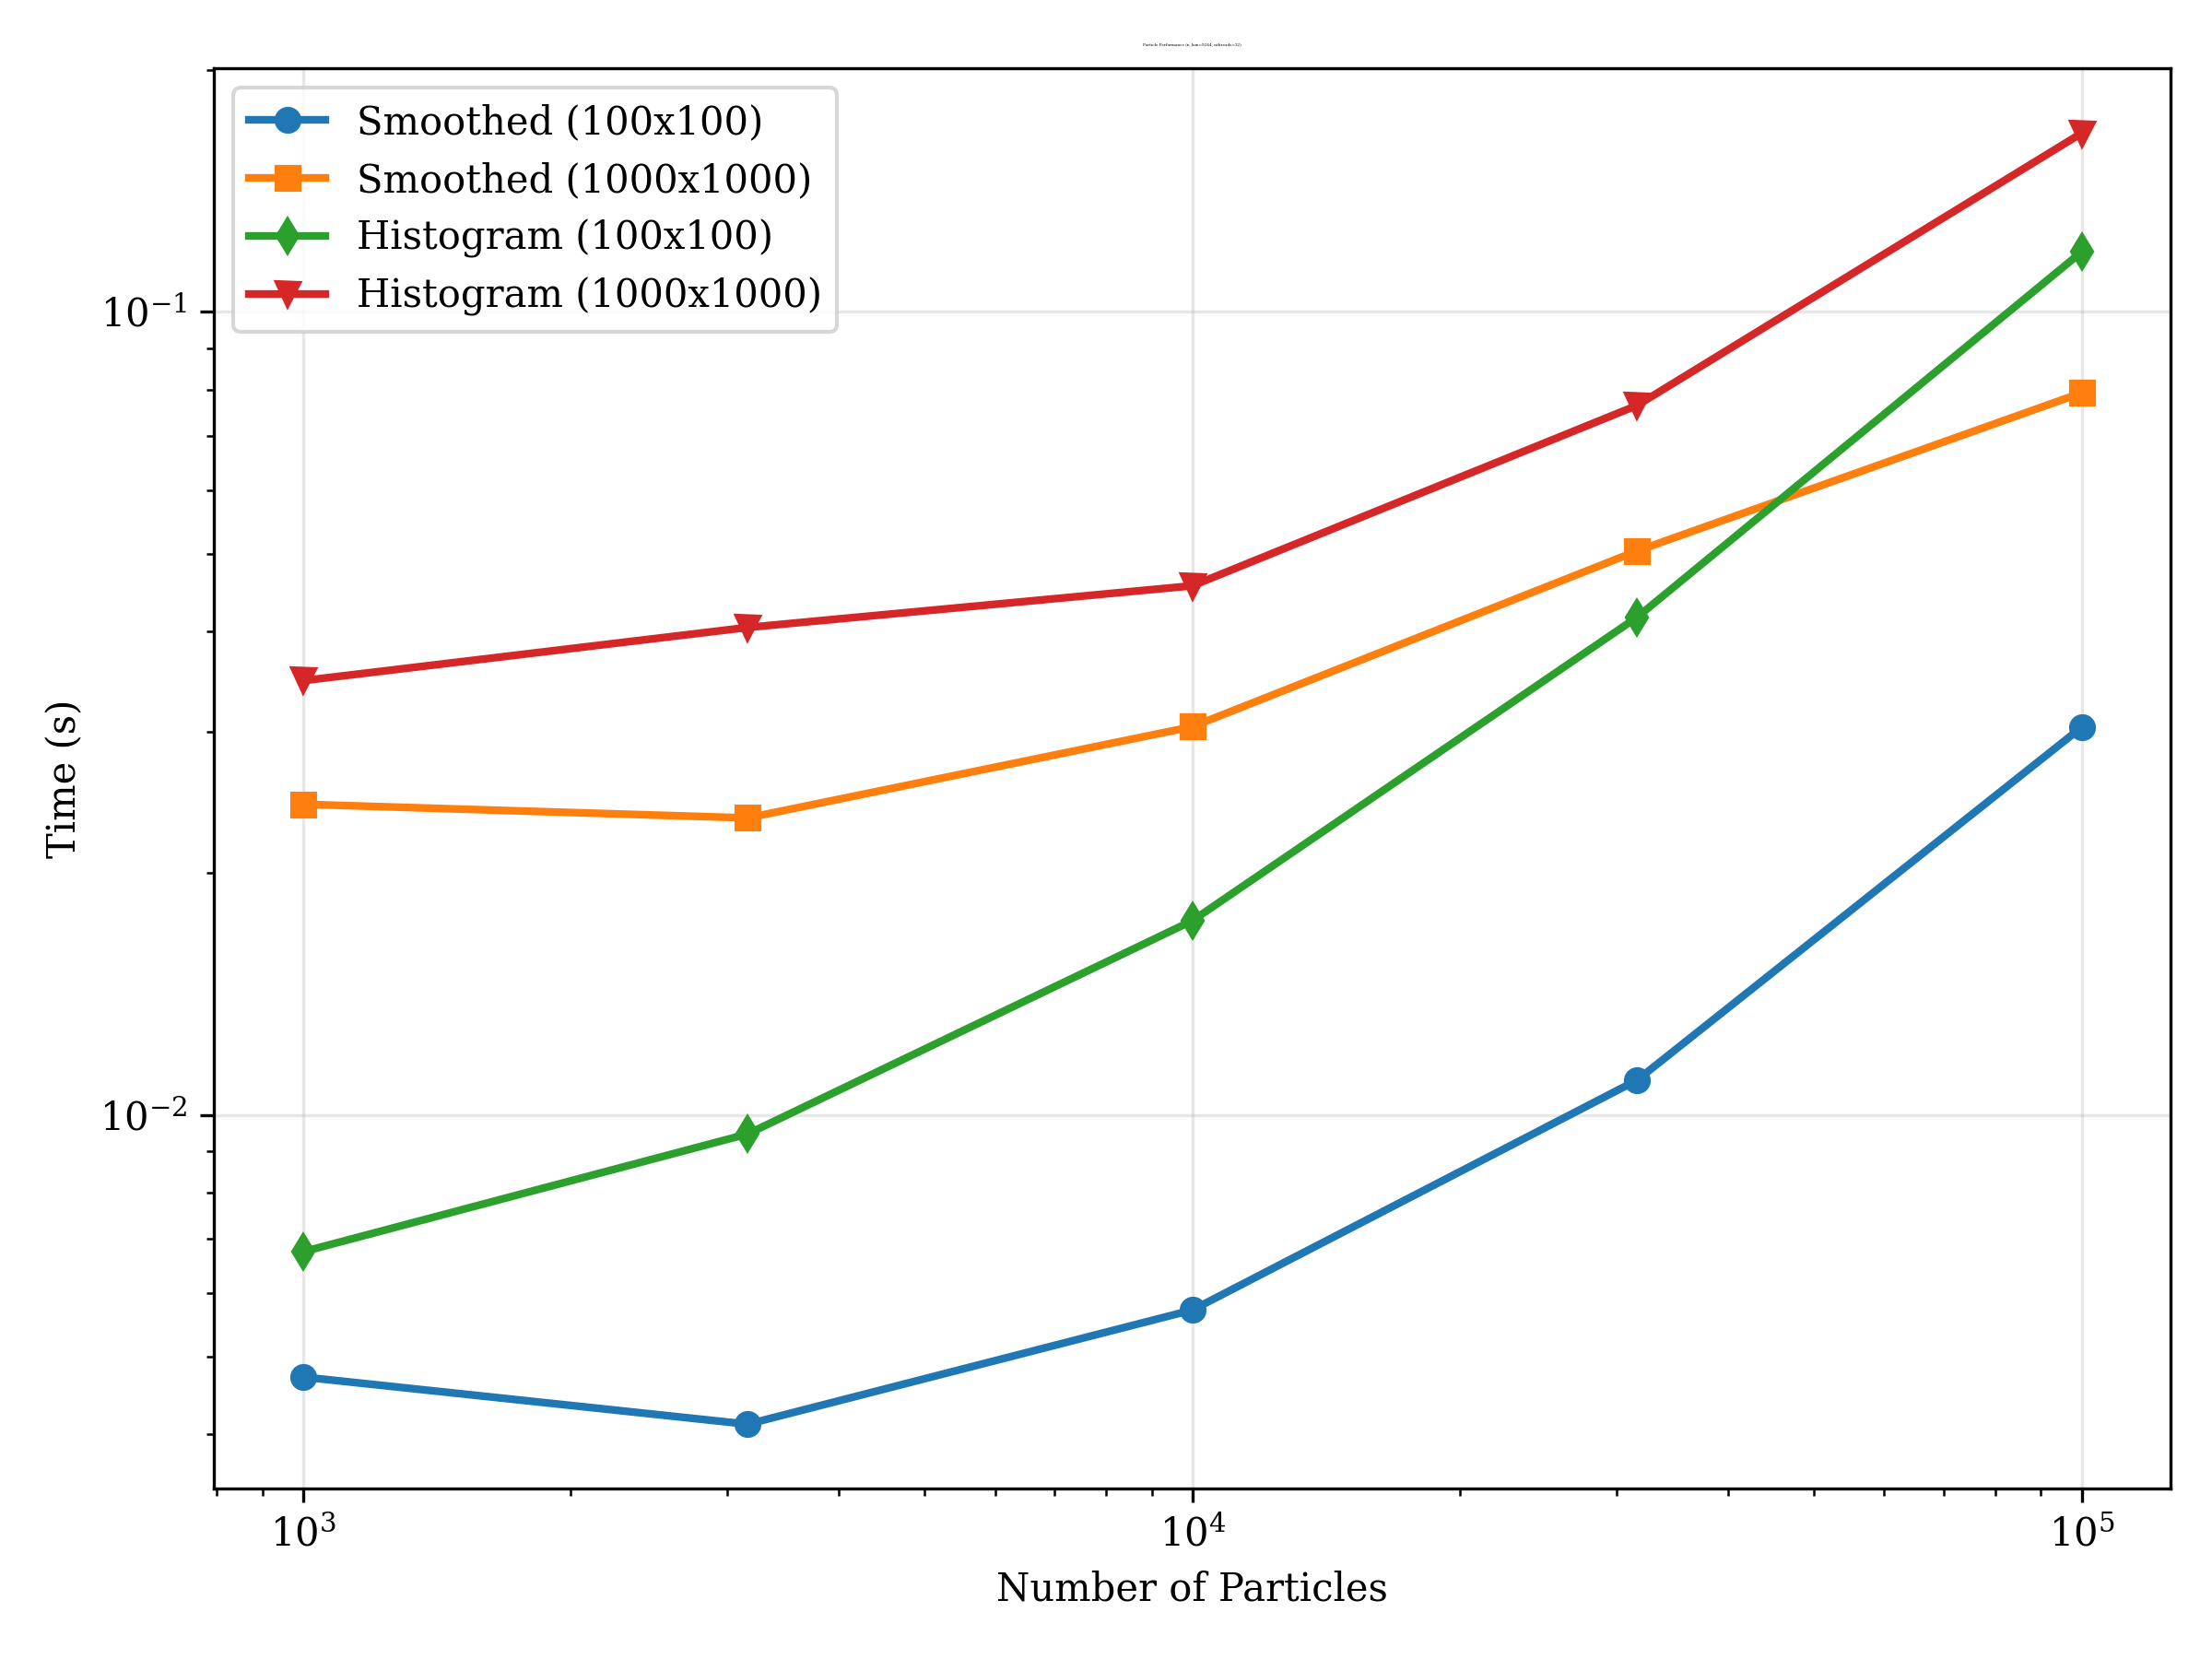
Imaging
Imaging benchmarks include both smoothed and histogram-based methods at different pixel resolutions (100×100 and 1000×1000).
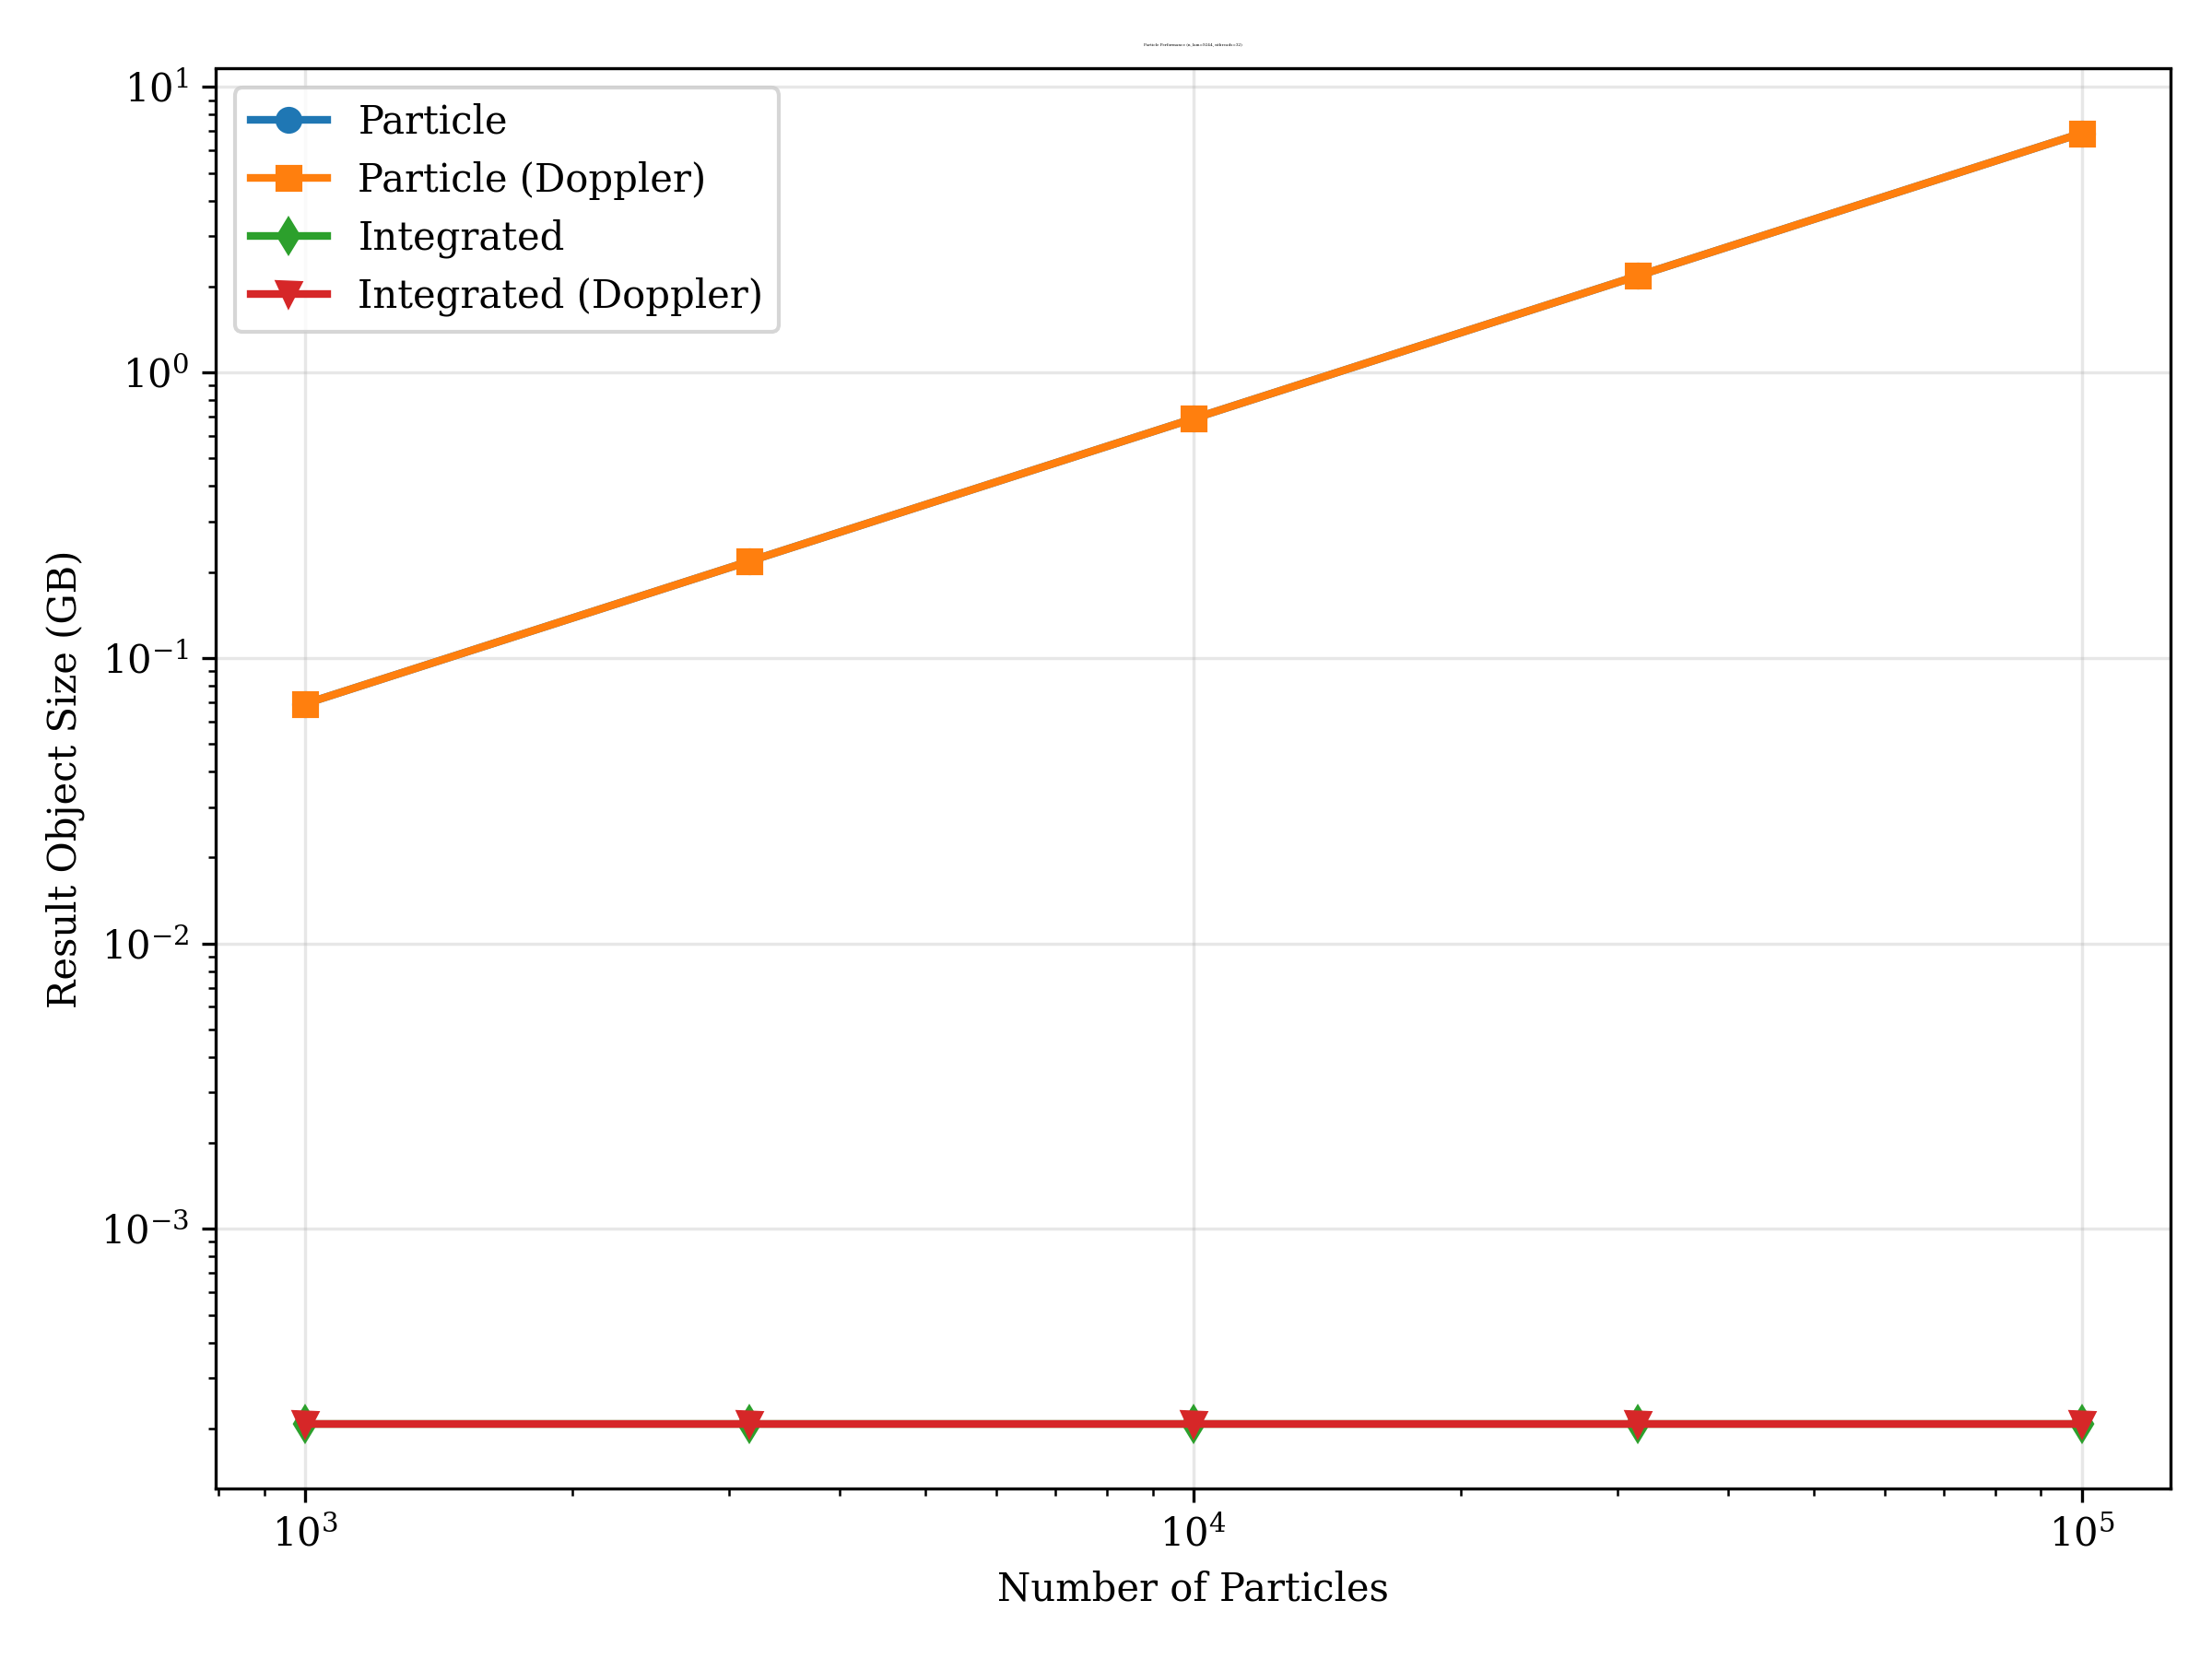
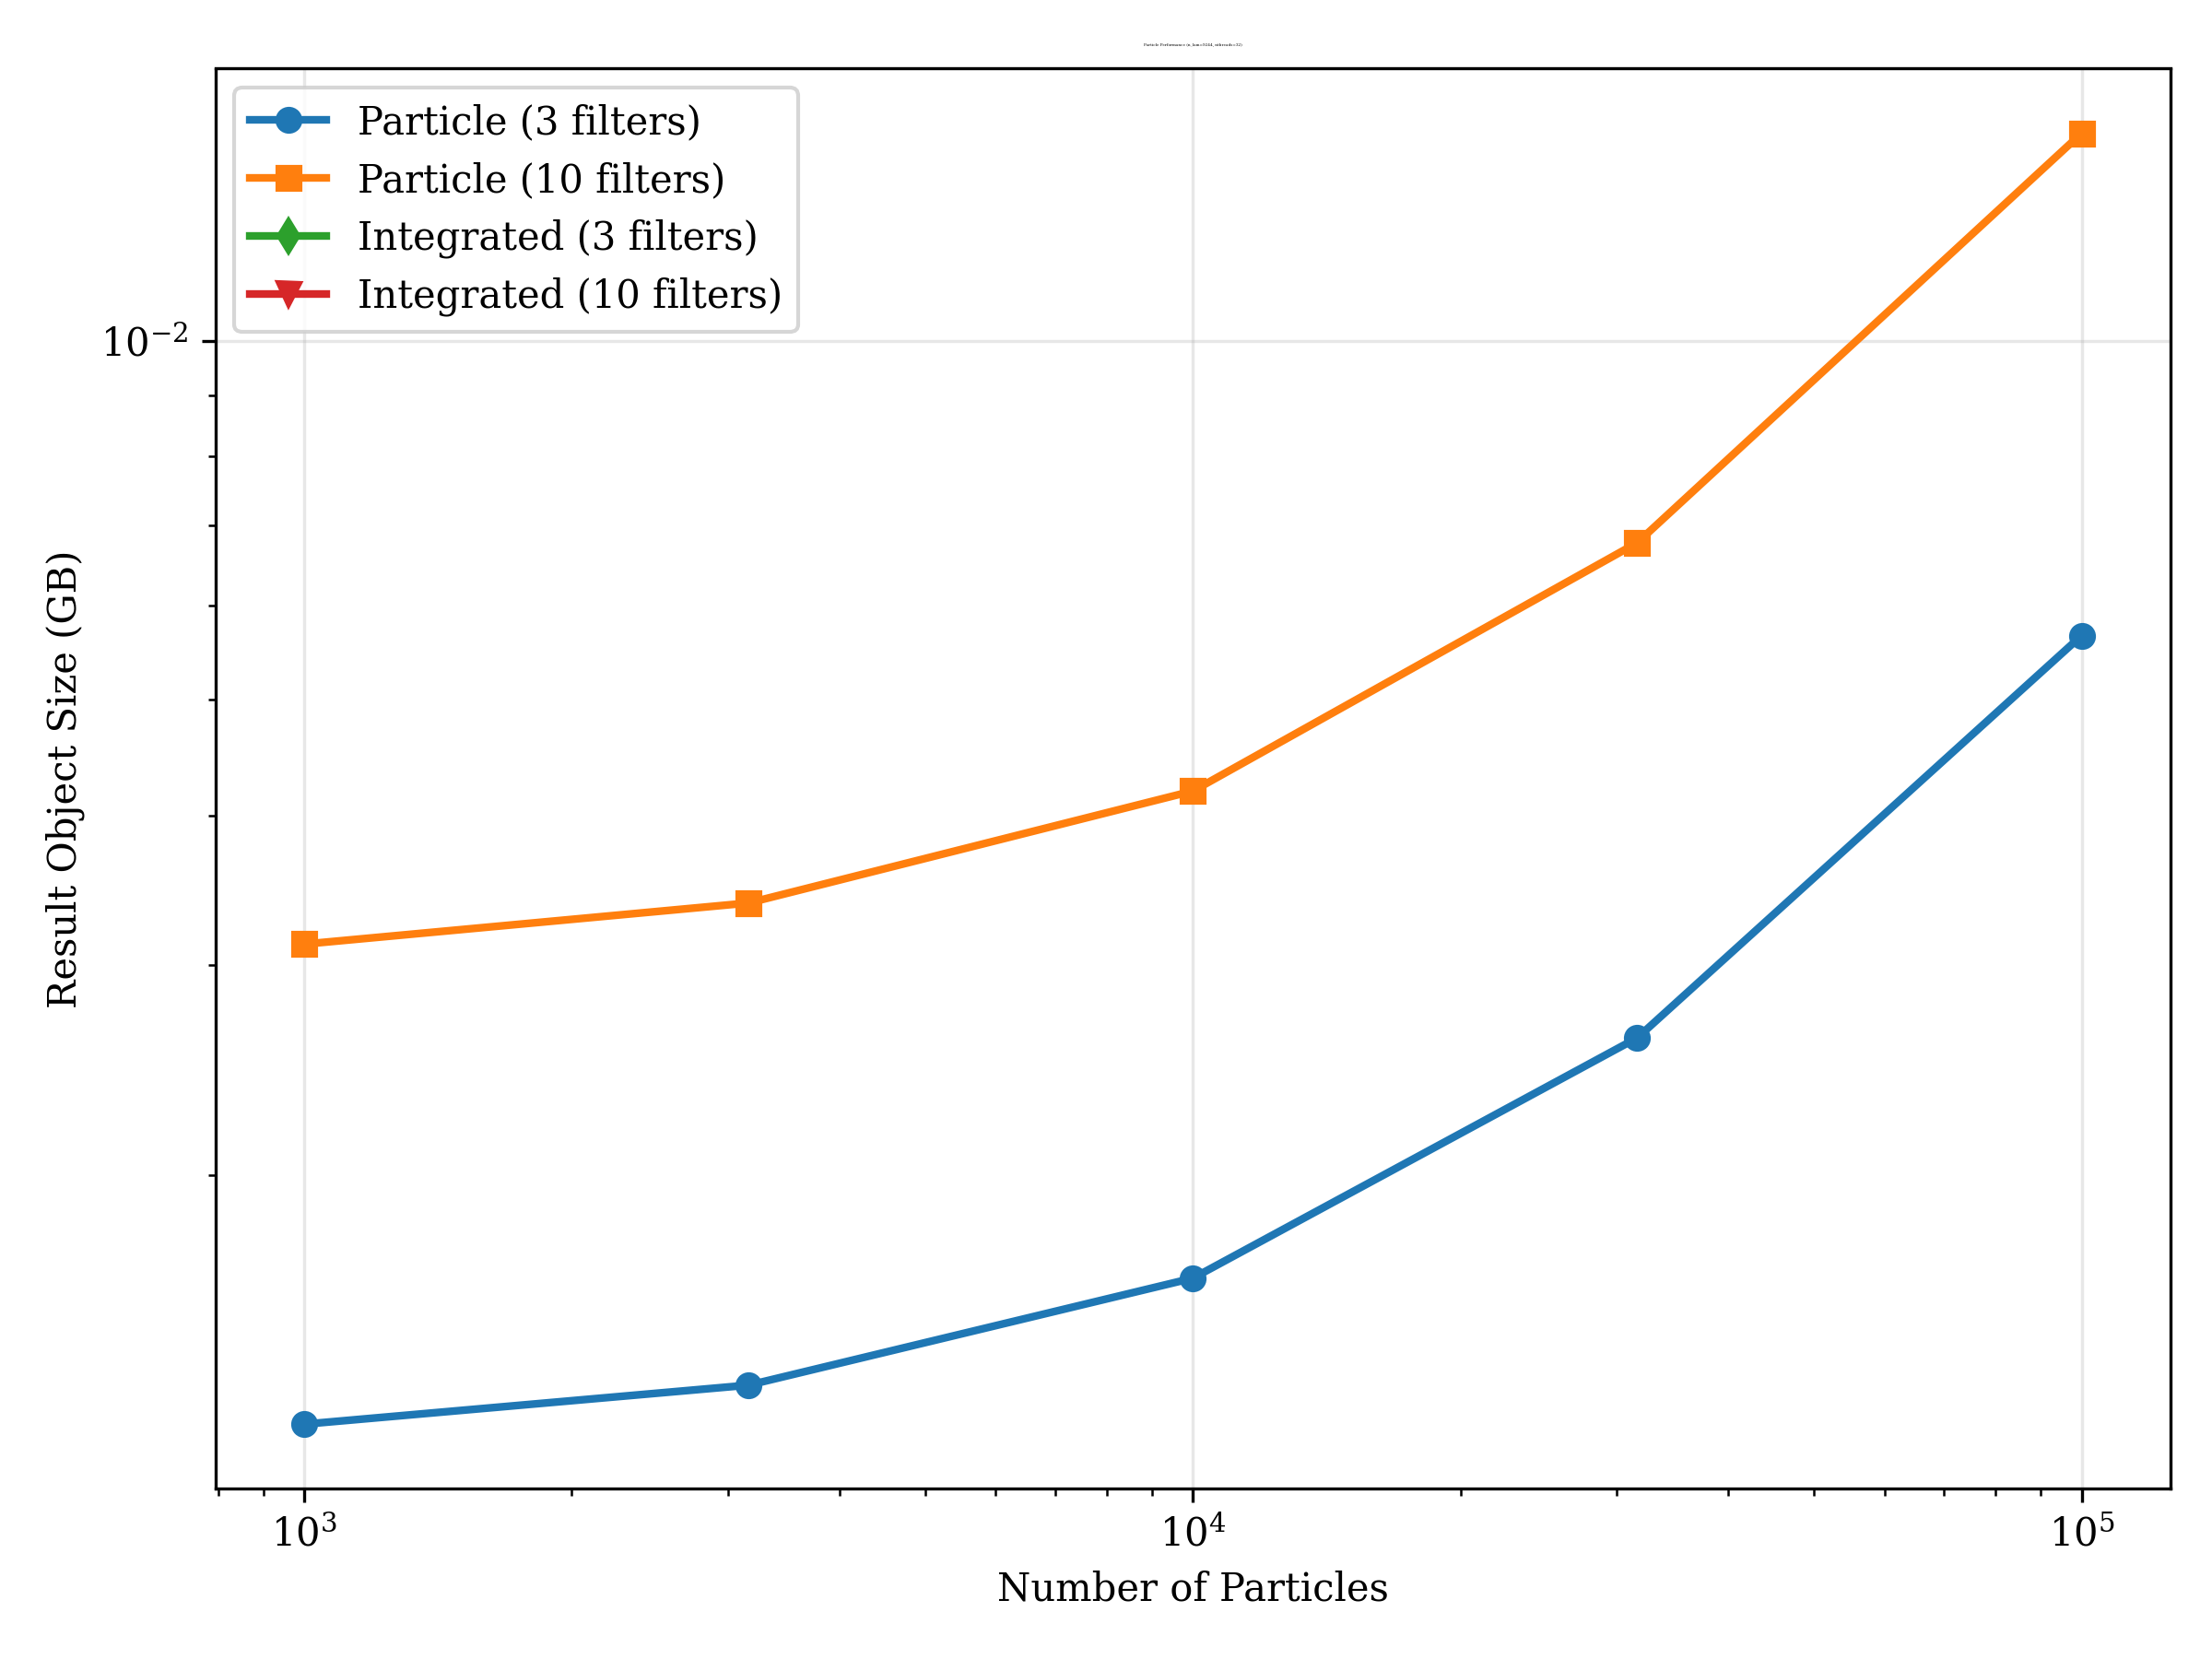
Memory Footprint
These plots show the memory size of the generated spectra and photometry objects as a function of the number of particles.
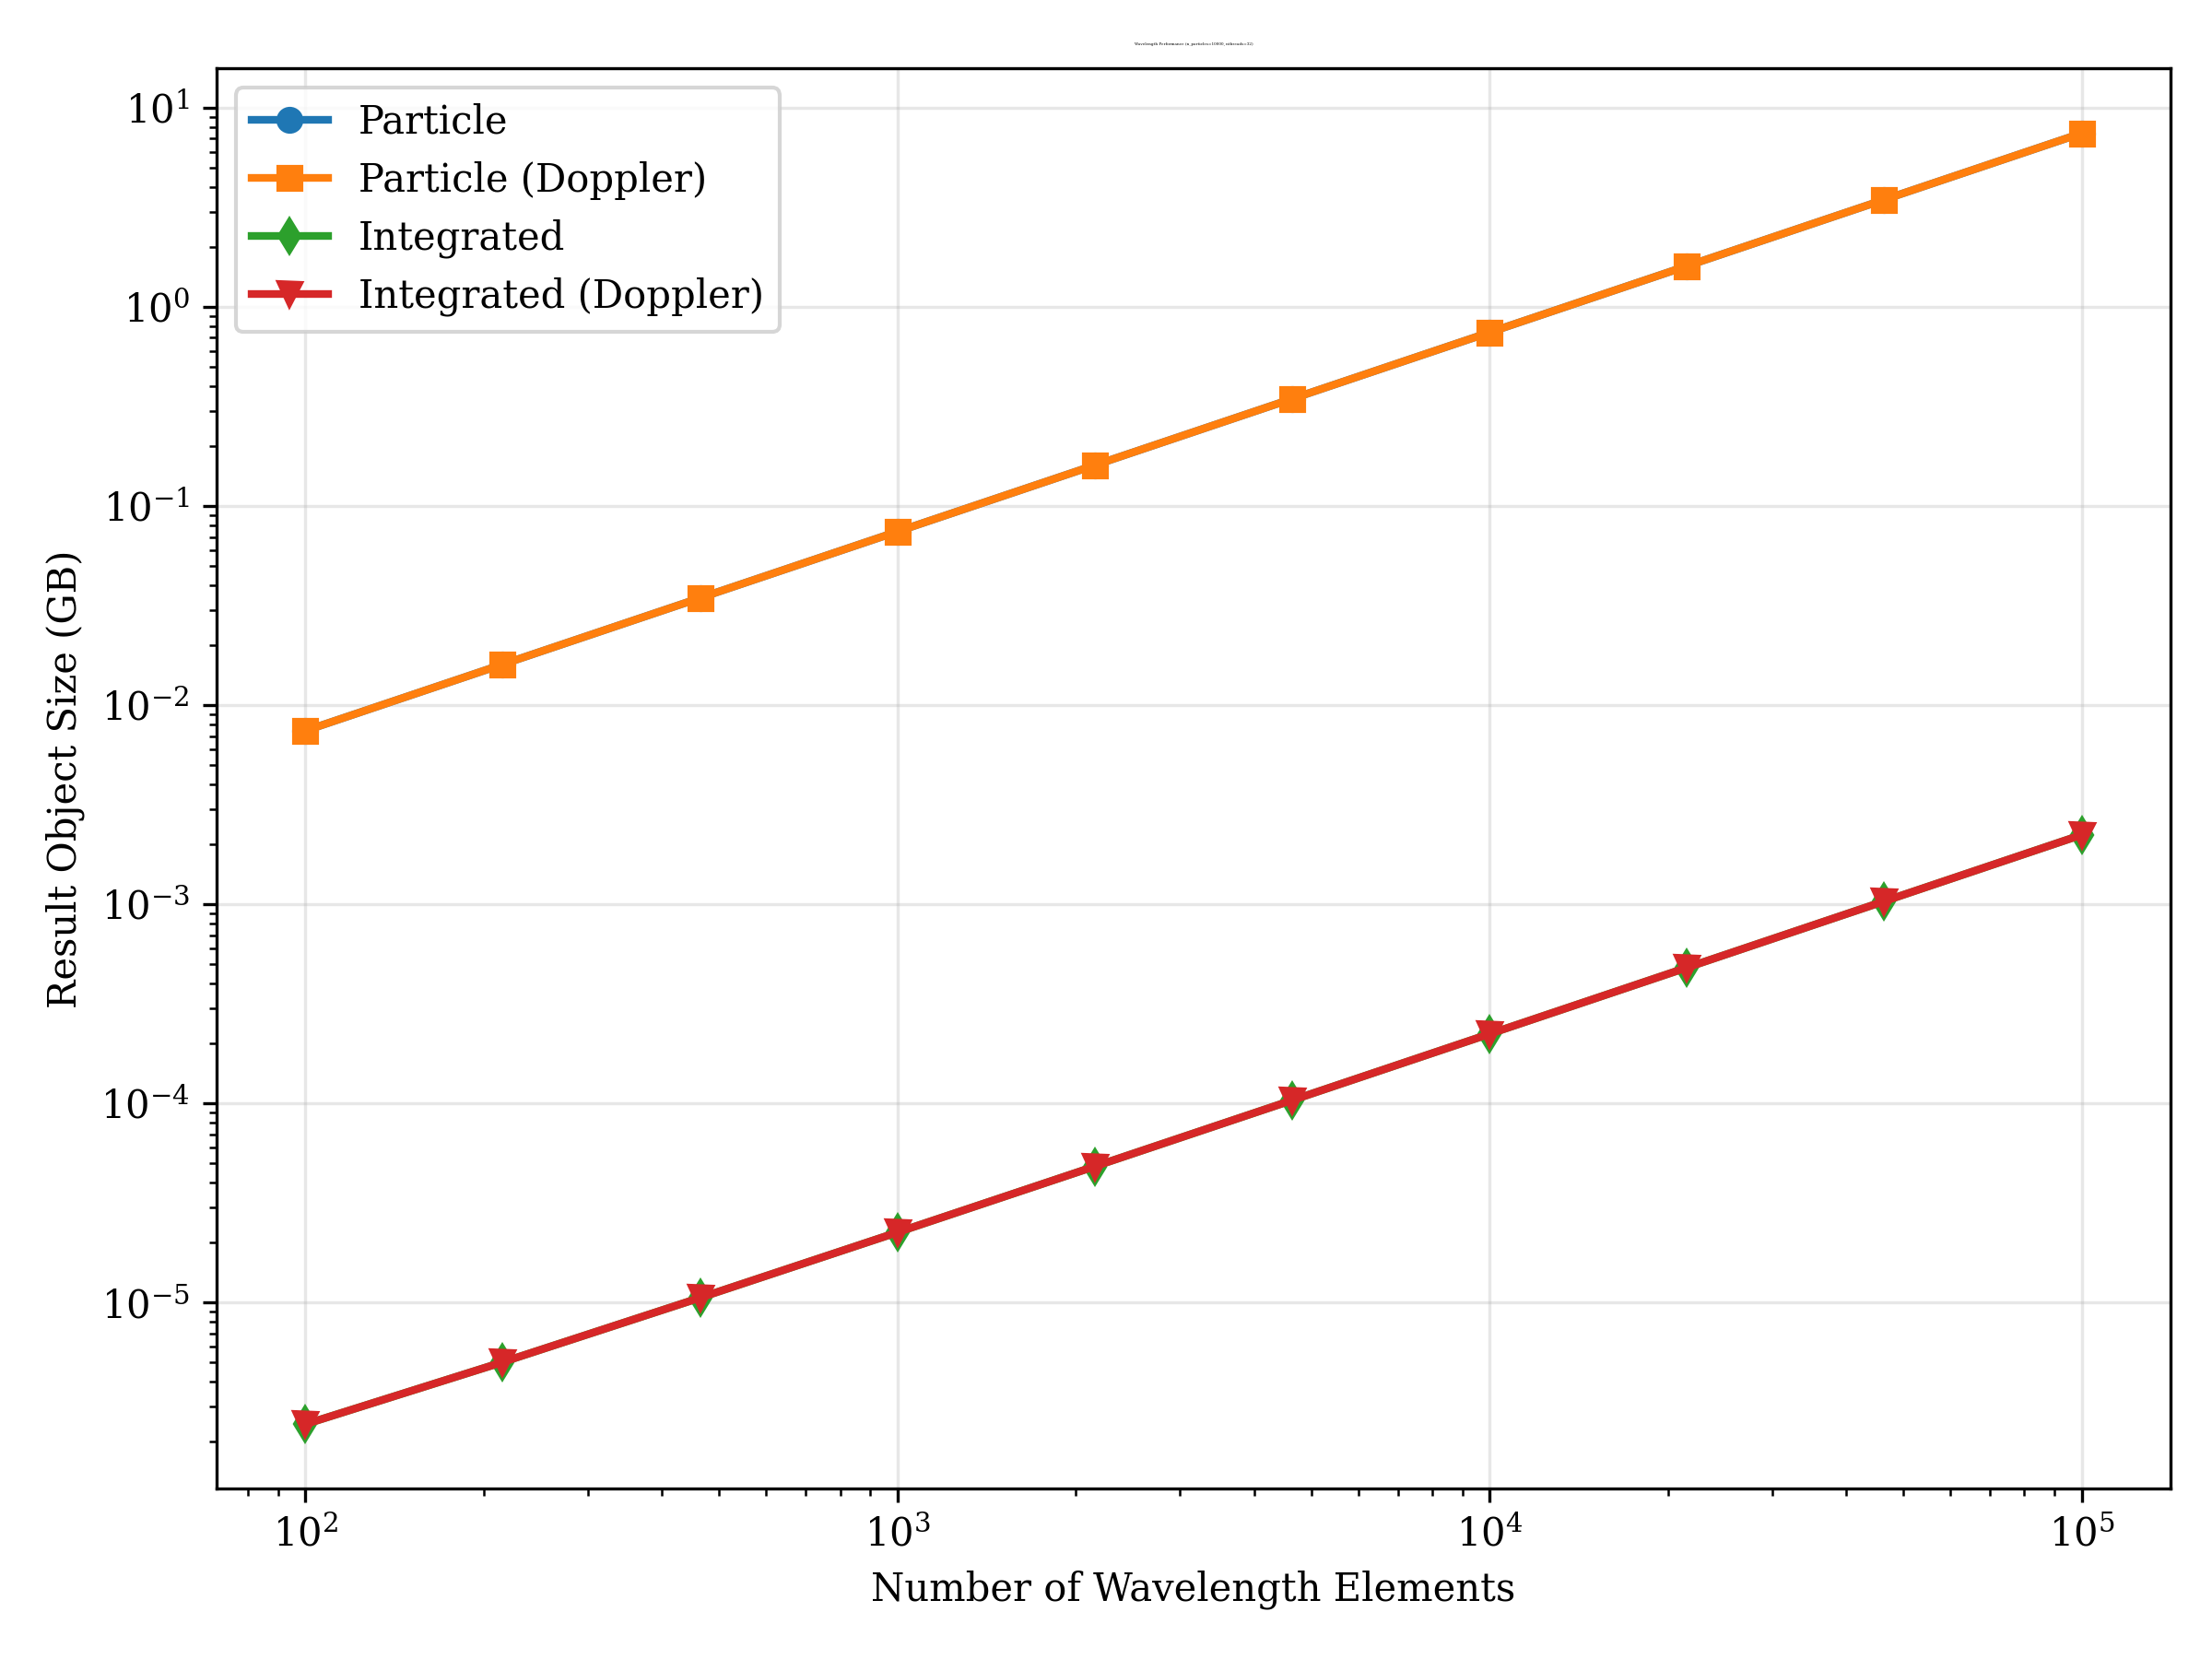
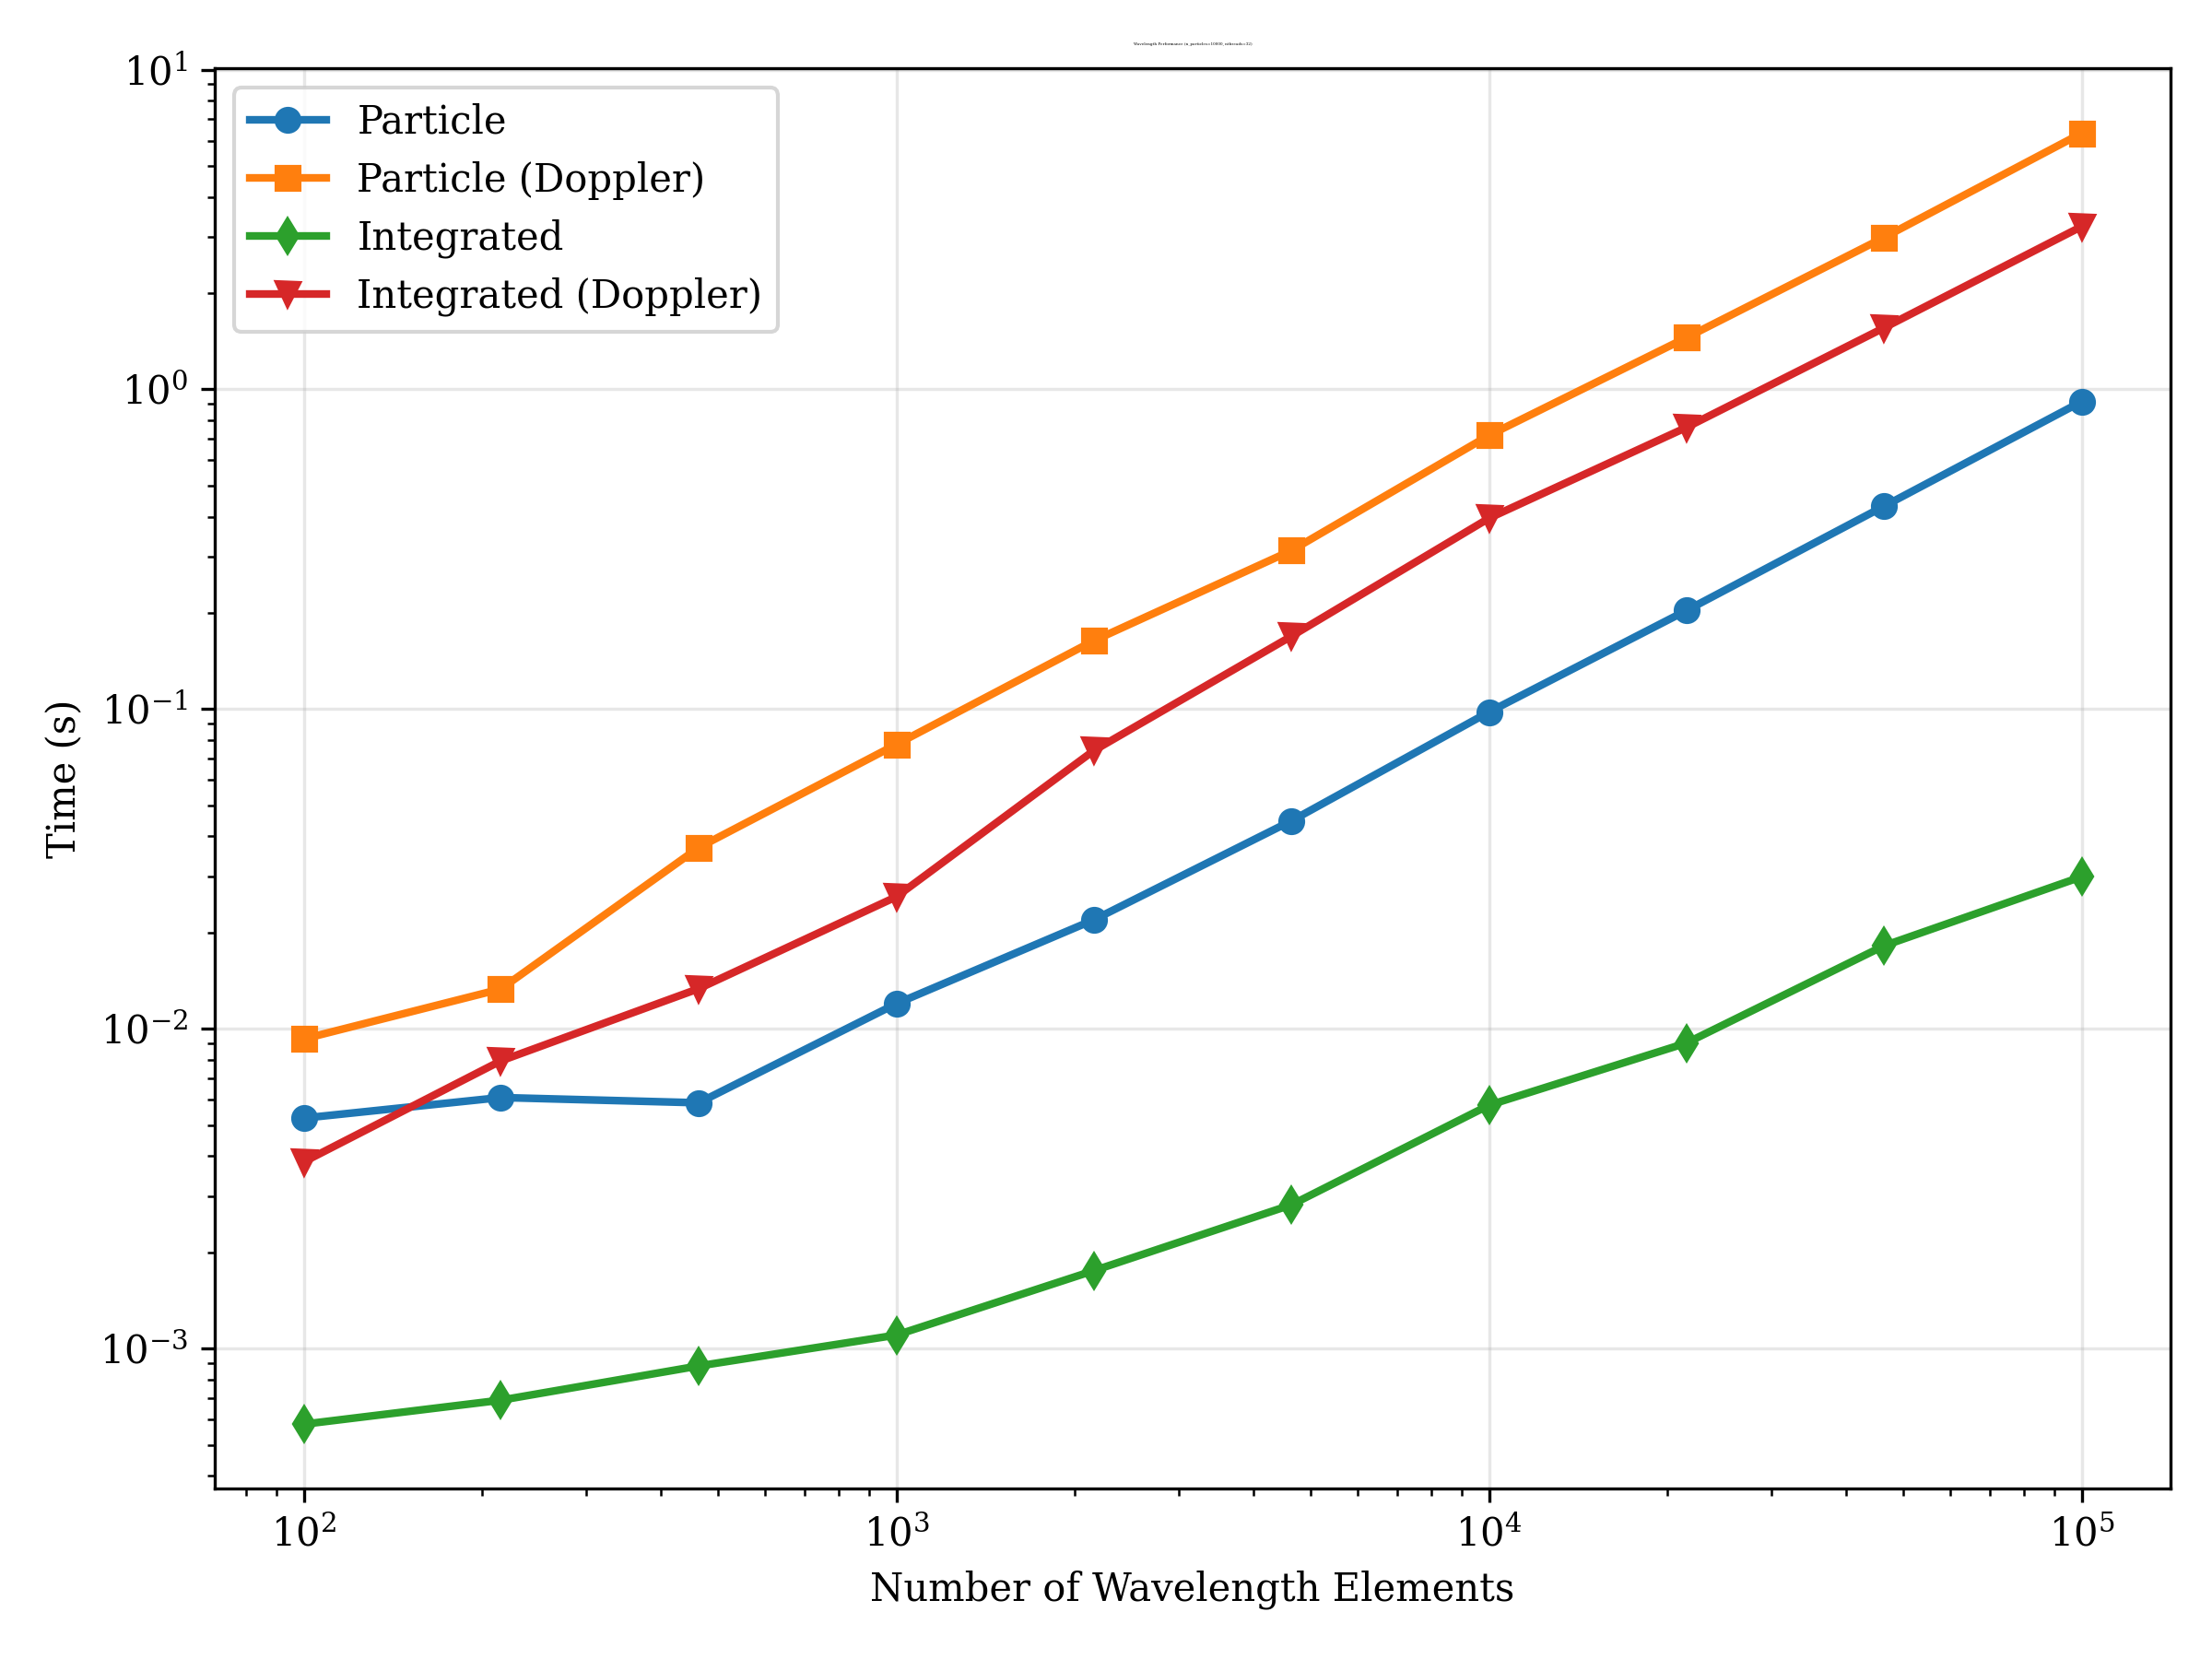
Wavelength Scaling
The following plots show the scaling of spectra generation with the number of wavelength elements in the SPS grid (from 100 to 100,000 elements). These tests were run using a component with 10,000 particles.
Runtime Scaling
Memory Footprint
This plot shows the memory size of the generated spectra as a function of the number of wavelength elements in the grid.