synthesizer.base_galaxy
A module for common functionality in Parametric and Particle Galaxies.
The class described in this module should never be directly instantiated. It only contains common attributes and methods to reduce boilerplate.
Classes
- class synthesizer.base_galaxy.BaseGalaxy(stars, gas, black_holes, redshift, centre, **kwargs)[source]
The base galaxy class.
This should never be directly instantiated. It instead contains the common functionality and attributes needed for parametric and particle galaxies.
- spectra
The dictionary containing a Galaxy’s spectra. Each entry is an Sed object. This dictionary only contains combined spectra from All components that make up the Galaxy (Stars, Gas, BlackHoles).
- Type:
dict, Sed
- stars
The Stars object holding information about the stellar population.
- Type:
particle.Stars/parametric.Stars
- gas
The Gas object holding information about the gas distribution.
- Type:
particle.Gas/parametric.Gas
- black_holes
The BlackHole/s object holding information about the black hole/s.
- Type:
particle.BlackHoles/parametric.BlackHole
- redshift
The redshift of the galaxy.
- Type:
float
- photo_lnu
The dictionary containing the photometry luminosities in spectral luminosity density units for each spectrum in Galaxy.spectra.
- Type:
dict
- photo_fnu
The dictionary containing the photometry fluxes in spectral flux density units for each spectrum in Galaxy.spectra.
- Type:
dict
- images_lnu
The dictionary containing the images in spectral luminosity density units.
- Type:
dict
- images_fnu
The dictionary containing the images in spectral flux density units.
- Type:
dict
- images_psf_lnu
The dictionary containing the images in spectral luminosity density units with a PSF applied.
- Type:
dict
- model_param_cache
A cache for parameters calculated by emission models.
- Type:
dict
- clear_all_emissions()[source]
Clear all spectra, lines and photometry.
This method is a quick helper to clear all spectra, lines, and photometry from the galaxy object and its components. This will cover both integrated and per particle emission.
- clear_all_lines()[source]
Clear all lines.
This method is a quick helper to clear all lines from the galaxy object and its components. This will cover both integrated and per particle lines if present.
- clear_all_photometry()[source]
Clear all photometry.
This method is a quick helper to clear all photometry from the galaxy object and its components. This will cover both integrated and per particle photometry if present.
- clear_all_spectra()[source]
Clear all spectra.
This method is a quick helper to clear all spectra from the galaxy object and its components. This will cover both integrated and per particle spectra if present.
- clear_all_spectroscopy()[source]
Clear all spectroscopy.
This method is a quick helper to clear all spectroscopy from the galaxy object and its components. This will cover both integrated and per particle spectroscopy if present.
- clear_weights()[source]
Clear all cached grid weights.
This clears all grid weights calculated using different methods from this base galaxy, and resets the _grid_weights dictionary.
- get_angular_diameter_distance(cosmo)[source]
Get the angular diameter distance of the galaxy.
This requires the redshift to be set on the galaxy.
This will use the astropy cosmology module to calculate the angular diameter distance. If the redshift is 0, the distance will be set to 10 pc to avoid any issues with 0s.
- Parameters:
cosmo (astropy.cosmology) – The cosmology to use for the calculation.
- Returns:
The angular diameter distance of the galaxy in kpc.
- Return type:
unyt_quantity
- get_equivalent_width(feature, blue, red, spectra_type)[source]
Get all equivalent widths associated with a sed object.
- Parameters:
feature (str) – The feature to measure the equivalent width of. e.g. “Halpha”, “Hbeta”, “MgII”, etc.
blue (float) – The blue side of the feature to measure.
red (float) – The red side of the feature to measure.
spectra_type (str/list) – The spectra type to measure the equivalent width of. Either a single type (str): or a list of types.
- Returns:
The equivalent width of the feature in the spectra.
- Return type:
equivalent_width (float/dict of float)
- get_images_flux(*labels, fov, instrument, img_type='smoothed', kernel=None, kernel_threshold=1, nthreads=1, cosmo=None)[source]
Make an ImageCollection from fluxes.
For Parametric Galaxy objects, images can only be smoothed. An exception will be raised if a histogram is requested.
For Particle Galaxy objects, images can either be a simple histogram (“hist”) or an image with particles smoothed over their SPH kernel.
Which images are produced is defined by the labels passed. If any of the necessary photometry is missing for generating a particular image, an exception will be raised.
Note that black holes will never be smoothed and only produce a histogram due to the point source nature of black holes.
All images that are created will be stored on the emitter (Stars, BlackHole/s, or galaxy) under the images_fnu attribute.
- Parameters:
*labels (str) – The labels of the emission models to make images for. These must be present in the photometry dicts of the components or the galaxy. For particle components, these labels must be present in the particle photometry dicts.
fov (unyt_quantity of float) – The width of the image in image coordinates.
instrument (Instrument) – The instrument to use for the image.
img_type (str) – The type of image to be made, either “hist” -> a histogram, or “smoothed” -> particles smoothed over a kernel for a particle galaxy. Otherwise, only smoothed is applicable.
kernel (np.ndarray of float) – The values from one of the kernels from the kernel_functions module. Only used for smoothed images.
kernel_threshold (float) – The kernel’s impact parameter threshold (by default 1).
nthreads (int) – The number of threads to use in the tree search. Default is 1.
cosmo (astropy.cosmology) – The cosmology to use for the calculation of the luminosity distance. Only needed for internal conversions from cartesian to angular coordinates when an angular resolution is used.
- Returns:
- ImageCollection/dict
Either a single ImageCollection if only one label is passed, otherwise a dict of ImageCollections keyed by label.
- get_images_luminosity(*labels, fov, instrument, img_type='smoothed', kernel=None, kernel_threshold=1, nthreads=1, cosmo=None)[source]
Make an ImageCollection from luminosities.
For Parametric Galaxy objects, images can only be smoothed. An exception will be raised if a histogram is requested.
For Particle Galaxy objects, images can either be a simple histogram (“hist”) or an image with particles smoothed over their SPH kernel.
Which images are produced is defined by the labels passed. If any of the necessary photometry is missing for generating a particular image, an exception will be raised.
Note that black holes will never be smoothed and only produce a histogram due to the point source nature of black holes.
All images that are created will be stored on the emitter (Stars, BlackHole/s, or galaxy) under the images_lnu attribute.
- Parameters:
*labels (str) – The labels of the emission models to make images for. These must be present in the photometry dicts of the components or the galaxy. For particle components, these labels must be present in the particle photometry dicts.
fov (unyt_quantity of float) – The width of the image in image coordinates.
instrument (Instrument) – The instrument to use for the image.
img_type (str) – The type of image to be made, either “hist” -> a histogram, or “smoothed” -> particles smoothed over a kernel for a particle galaxy. Otherwise, only smoothed is applicable.
kernel (np.ndarray of float) – The values from one of the kernels from the kernel_functions module. Only used for smoothed images.
kernel_threshold (float) – The kernel’s impact parameter threshold (by default 1).
nthreads (int) – The number of threads to use in the tree search. Default is 1.
cosmo (astropy.cosmology) – The cosmology to use for the calculation of the luminosity distance. Only needed for internal conversions from cartesian to angular coordinates when an angular resolution is used.
- Returns:
- ImageCollection/dict
Either a single ImageCollection if only one label is passed, otherwise a dict of ImageCollections keyed by label.
- get_lines(line_ids, emission_model, dust_curves=None, tau_v=None, fesc=None, covering_fraction=None, mask=None, verbose=True, **kwargs)[source]
Generate lines as described by the emission model.
- Parameters:
line_ids (list) – A list of line ids to include in the spectra.
emission_model (EmissionModel) – The emission model to use.
dust_curves (dict) –
- An override to the emission model dust curves. Either:
None, indicating the dust_curves defined on the emission models should be used.
A single dust curve to apply to all emission models.
A dictionary of the form {<label>: <dust_curve instance>} to use a specific dust curve instance with particular properties.
tau_v (dict) –
- An override to the dust model optical depth. Either:
None, indicating the tau_v defined on the emission model should be used.
A float to use as the optical depth for all models.
A dictionary of the form {<label>: float(<tau_v>)} to use a specific optical depth with a particular model or {<label>: str(<attribute>)} to use an attribute of the component as the optical depth.
fesc (dict) –
- An override to the emission model escape fraction. Either:
None, indicating the fesc defined on the emission model should be used.
A float to use as the escape fraction for all models.
A dictionary of the form {<label>: float(<fesc>)} to use a specific escape fraction with a particular model or {<label>: str(<attribute>)} to use an attribute of the component as the escape fraction.
covering_fraction (dict) –
- An override to the emission model covering fraction. Either:
- None, indicating the covering fraction defined on the
emission model should be used.
A float to use as the covering fraction for all models.
- A dictionary of the form
{<label>: float(<covering_fraction>)} to use a specific covering fraction with a particular model or {<label>: str(<attribute>)} to use an attribute of the component as the covering fraction.
mask (dict) –
- An override to the emission model mask. Either:
None, indicating the mask defined on the emission model should be used.
A dictionary of the form {<label>: {“attr”: attr, “thresh”: thresh, “op”: op}} to add a specific mask to a particular model.
verbose (bool) – Are we talking?
kwargs (dict) – Any additional keyword arguments to pass to the generator function.
- Returns:
- dict
The combined lines for the galaxy.
- get_luminosity_distance(cosmo)[source]
Get the luminosity distance of the galaxy.
This requires the redshift to be set on the galaxy.
This will use the astropy cosmology module to calculate the luminosity distance. If the redshift is 0, the distance will be set to 10 pc to avoid any issues with 0s.
- Parameters:
cosmo (astropy.cosmology) – The cosmology to use for the calculation.
- Returns:
The luminosity distance of the galaxy in kpc.
- Return type:
unyt_quantity
- get_observed_lines(cosmo, igm=<class 'synthesizer.emission_models.transformers.igm.Inoue14'>)[source]
Calculate the observed lines for all Line objects.
This will run Line.get_fnu(…) and populate Line.fnu (and Line.obslam and Line.obsnu) for all lines in: - Galaxy.lines - Galaxy.stars.lines - Galaxy.gas.lines (WIP) - Galaxy.black_holes.lines
And in the case of particle galaxies - Galaxy.stars.particle_lines - Galaxy.gas.particle_lines (WIP) - Galaxy.black_holes.particle_lines
- Parameters:
cosmo (astropy.cosmology.Cosmology) – The cosmology object containing the cosmological model used to calculate the luminosity distance.
igm (igm) – The object describing the intergalactic medium (defaults to Inoue14).
- Raises:
MissingAttribute – If a galaxy has no redshift we can’t get the observed lines.
- get_observed_spectra(cosmo, igm=<class 'synthesizer.emission_models.transformers.igm.Inoue14'>, nthreads=1)[source]
Calculate the observed spectra for all Seds within this galaxy.
This will run Sed.get_fnu(…) and populate Sed.fnu (and sed.obslam and sed.obsnu) for all spectra in: - Galaxy.spectra - Galaxy.stars.spectra - Galaxy.gas.spectra (WIP) - Galaxy.black_holes.spectra
And in the case of particle galaxies - Galaxy.stars.particle_spectra - Galaxy.gas.particle_spectra (WIP) - Galaxy.black_holes.particle_spectra
- Parameters:
cosmo (astropy.cosmology.Cosmology) – The cosmology object containing the cosmological model used to calculate the luminosity distance.
igm (igm) – The object describing the intergalactic medium (defaults to Inoue14).
nthreads (int) – The number of threads to use for observer-frame flux conversion.
- Raises:
MissingAttribute – If a galaxy has no redshift we can’t get the observed spectra.
- get_photo_fnu(filters, verbose=True, nthreads=1, limit_to=None)[source]
Calculate flux photometry using a FilterCollection object.
Photometry is calculated in spectral flux density units.
- Parameters:
filters (FilterCollection) – A FilterCollection object.
verbose (bool) – Are we talking?
nthreads (int) – The number of threads to use for the integration. If -1, all threads will be used.
limit_to (str/list, optional) – If None, then photometry is calculated for all spectra in the galaxy. If a string or list of strings is provided, then photometry is only calculated for the specified spectra.
- Returns:
A PhotometryCollection object containing the flux photometry in each filter in filters.
- Return type:
- get_photo_lnu(filters, verbose=True, nthreads=1, limit_to=None)[source]
Calculate luminosity photometry using a FilterCollection object.
Photometry is calculated in spectral luminosity density units.
- Parameters:
filters (FilterCollection) – A FilterCollection object.
verbose (bool) – Are we talking?
nthreads (int) – The number of threads to use for the integration. If -1, all threads will be used.
limit_to (str/list, optional) – If None, then photometry is calculated for all spectra in the galaxy. If a string or list of strings is provided, then photometry is only calculated for the specified spectra.
- Returns:
A PhotometryCollection object containing the luminosity photometry in each filter in filters.
- Return type:
- get_spectra(emission_model, dust_curves=None, tau_v=None, fesc=None, covering_fraction=None, mask=None, vel_shift=None, verbose=True, **kwargs)[source]
Generate spectra as described by the emission model.
- Parameters:
emission_model (EmissionModel) – The emission model to use.
dust_curves (dict) –
- An override to the emission model dust curves. Either:
None, indicating the dust_curves defined on the emission models should be used.
A single dust curve to apply to all emission models.
A dictionary of the form {<label>: <dust_curve instance>} to use a specific dust curve instance with particular properties.
tau_v (dict) –
- An override to the dust model optical depth. Either:
None, indicating the tau_v defined on the emission model should be used.
A float to use as the optical depth for all models.
A dictionary of the form {<label>: float(<tau_v>)} to use a specific optical depth with a particular model or {<label>: str(<attribute>)} to use an attribute of the component as the optical depth.
fesc (dict) –
- An override to the emission model escape fraction. Either:
None, indicating the fesc defined on the emission model should be used.
A float to use as the escape fraction for all models.
A dictionary of the form {<label>: float(<fesc>)} to use a specific escape fraction with a particular model or {<label>: str(<attribute>)} to use an attribute of the component as the escape fraction.
covering_fraction (dict) –
- An override to the emission model covering fraction. Either:
- None, indicating the covering fraction defined on the
emission model should be used.
A float to use as the covering fraction for all models.
- A dictionary of the form
{<label>: float(<covering_fraction>)} to use a specific covering fraction with a particular model or {<label>: str(<attribute>)} to use an attribute of the component as the covering fraction.
mask (dict) –
- An override to the emission model mask. Either:
None, indicating the mask defined on the emission model should be used.
A dictionary of the form {<label>: {“attr”: attr, “thresh”: thresh, “op”: op}} to add a specific mask to a particular model.
vel_shift (bool) – An overide to the model level velocity shift flag. If True then the velocity shift is applied when generating all spectra.
verbose (bool) – Are we talking?
kwargs (dict) – Any additional keyword arguments to pass to the generator function.
- Returns:
- dict
The combined spectra for the galaxy.
- get_spectra_combined()[source]
Combine all common spectra from components onto the galaxy.
- e.g.:
intrinsc = stellar_intrinsic + black_hole_intrinsic.
For any combined spectra all components with a valid spectra will be combined and stored in Galaxy.spectra under the same key, but only if there are instances of a spectra containing that name to combine.
- Possible combined spectra are:
“total”
“intrinsic”
“emergent”
Note that this process is only applicable to integrated spectra.
- get_spectroscopy(instrument, limit_to=None)[source]
Get spectroscopy for the galaxy based on a specific instrument.
This method now acts as an orchestration wrapper around the instrument-owned spectroscopy path. It fetches the relevant SEDs, passes them into the instrument, stores the returned spectroscopy, and then repeats the same orchestration for any attached components.
- Parameters:
instrument (Instrument) – The instrument to use for the spectroscopy.
limit_to (str/list, optional) – If None, then spectroscopy is calculated for all spectra in the galaxy. If a string or list of strings is provided, then spectroscopy is only calculated for the specified spectra.
- Returns:
- dict
The spectroscopy for the galaxy.
- get_surviving_mass(grid, **kwargs)[source]
Calculate the surviving mass of the stellar population.
This is the total mass of stars that have survived to the present day given the star formation and metal enrichment history.
- Parameters:
grid (Grid) – The grid to use for calculating the surviving mass. This is used to get the stellar fraction at each SFZH bin.
**kwargs (dict) – Additional keyword arguments to pass to the stars calculate_surviving_mass method. Only keyword used is ‘grid_assignment_method’, which is only used for particle galaxies.
- Returns:
The total surviving mass of the stellar population in Msun.
- Return type:
unyt_quantity
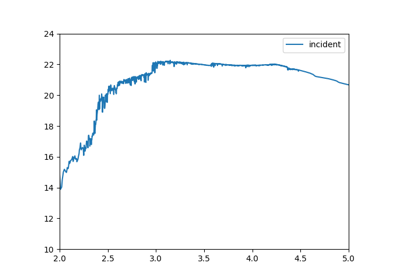
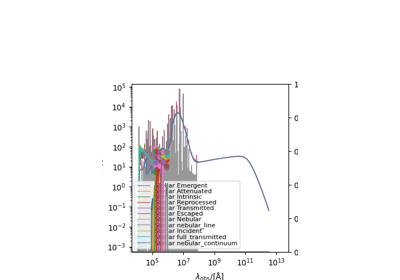
- plot_observed_spectra(combined_spectra=True, stellar_spectra=False, gas_spectra=False, black_hole_spectra=False, show=False, ylimits=(), xlimits=(), figsize=(3.5, 5), filters=None, quantity_to_plot='fnu')[source]
Plot observed spectra on this galaxy.
Plots either specific observed spectra (specified via combined_spectra, stellar_spectra, gas_spectra, and/or black_hole_spectra) or all spectra for any of the spectra arguments that are True. If any are false that component is ignored.
- Parameters:
combined_spectra (bool/list, string/string) –
- The specific combined galaxy spectra to plot. (e.g “total”)
If True all spectra are plotted.
If a list of strings each specific spectra is plotted.
If a single string then only that spectra is plotted.
stellar_spectra (bool/list, string/string) –
- The specific stellar spectra to plot. (e.g. “incident”)
If True all spectra are plotted.
If a list of strings each specific spectra is plotted.
If a single string then only that spectra is plotted.
gas_spectra (bool/list, string/string) –
- The specific gas spectra to plot. (e.g. “total”)
If True all spectra are plotted.
If a list of strings each specific spectra is plotted.
If a single string then only that spectra is plotted.
black_hole_spectra (bool/list, string/string) –
- The specific black hole spectra to plot. (e.g “blr”)
If True all spectra are plotted.
If a list of strings each specific spectra is plotted.
If a single string then only that spectra is plotted.
show (bool) – Flag for whether to show the plot or just return the figure and axes.
ylimits (tuple) – The limits to apply to the y axis. If not provided the limits will be calculated with the lower limit set to 1000 (100) times less than the peak of the spectrum for rest_frame (observed) spectra.
xlimits (tuple) – The limits to apply to the x axis. If not provided the optimal limits are found based on the ylimits.
figsize (tuple) – Tuple with size 2 defining the figure size.
filters (FilterCollection) – If given then the photometry is computed and both the photometry and filter curves are plotted
quantity_to_plot (string) – The sed property to plot. Can be “lnu”, “luminosity” or “llam” for rest frame spectra or “fnu”, “flam” or “flux” for observed spectra. Defaults to “lnu”.
- Returns:
- fig (matplotlib.pyplot.figure)
The matplotlib figure object for the plot.
- ax (matplotlib.axes)
The matplotlib axes object containing the plotted data.
- plot_observed_spectroscopy(instrument_label, combined_spectra=True, stellar_spectra=False, gas_spectra=False, black_hole_spectra=False, show=False, ylimits=(), xlimits=(), figsize=(3.5, 5), quantity_to_plot='fnu', fig=None, ax=None)[source]
Plot an instrument’s spectroscopy.
This will plot the spectroscopy for the galaxy and its components using the instrument’s wavelength array. The spectra are plotted in the order they are stored in the spectroscopy dictionary.
- Parameters:
instrument_label (str) – The label of the instrument whose spectroscopy to plot.
combined_spectra (bool/list, string/string) –
The specific combined galaxy spectroscopy to plot. (e.g “total”)
If True all spectra are plotted.
If a list of strings each specifc spectra is plotted.
If a single string then only that spectra is plotted.
stellar_spectra (bool/list, string/string) –
- The specific stellar spectroscopy to plot. (e.g. “incident”)
If True all spectra are plotted.
If a list of strings each specifc spectra is plotted.
If a single string then only that spectra is plotted.
gas_spectra (bool/list, string/string) –
- The specific gas spectroscopy to plot. (e.g. “total”)
If True all spectra are plotted.
If a list of strings each specifc spectra is plotted.
If a single string then only that spectra is plotted.
black_hole_spectra (bool/list, string/string) –
- The specific black hole spectroscopy to plot. (e.g “blr”)
If True all spectra are plotted.
If a list of strings each specifc spectra is plotted.
If a single string then only that spectra is plotted.
show (bool) – Flag for whether to show the plot or just return the figure and axes.
ylimits (tuple) – The limits to apply to the y axis. If not provided the limits will be calculated with the lower limit set to 1000 (100) times less than the peak of the spectrum for rest_frame (observed) spectra.
xlimits (tuple) – The limits to apply to the x axis. If not provided the optimal limits are found based on the ylimits.
figsize (tuple) – Tuple with size 2 defining the figure size.
quantity_to_plot (string) – The sed property to plot. Can be “lnu”, “luminosity” or “llam” for rest frame spectra or “fnu”, “flam” or “flux” for observed spectra. Defaults to “lnu”.
fig (matplotlib.pyplot.figure) – The matplotlib figure object to plot on. If None a new figure is created.
ax (matplotlib.axes) – The matplotlib axes object to plot on. If None a new axes is created.
- Returns:
- fig (matplotlib.pyplot.figure)
The matplotlib figure object for the plot.
- ax (matplotlib.axes)
The matplotlib axes object containing the plotted data.
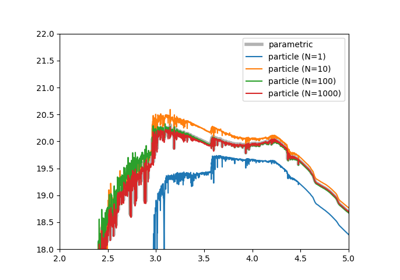
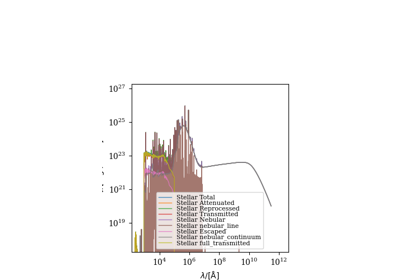
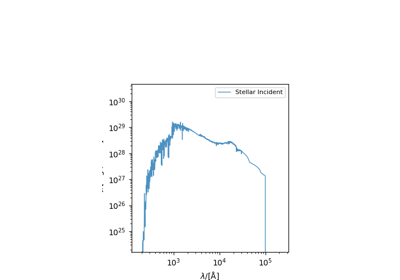
- plot_spectra(combined_spectra=True, stellar_spectra=False, gas_spectra=False, black_hole_spectra=False, show=False, ylimits=(), xlimits=(), figsize=(3.5, 5), quantity_to_plot='lnu')[source]
Plot spectra on this galaxy.
Plots either specific observed spectra (specified via combined_spectra, stellar_spectra, gas_spectra, and/or black_hole_spectra) or all spectra for any of the spectra arguments that are True. If any are false that component is ignored.
- Parameters:
combined_spectra (bool/list, string/string) –
- The specific combined galaxy spectra to plot. (e.g “total”)
If True all spectra are plotted.
If a list of strings each specific spectra is plotted.
If a single string then only that spectra is plotted.
stellar_spectra (bool/list, string/string) –
- The specific stellar spectra to plot. (e.g. “incident”)
If True all spectra are plotted.
If a list of strings each specific spectra is plotted.
If a single string then only that spectra is plotted.
gas_spectra (bool/list, string/string) –
- The specific gas spectra to plot. (e.g. “total”)
If True all spectra are plotted.
If a list of strings each specific spectra is plotted.
If a single string then only that spectra is plotted.
black_hole_spectra (bool/list, string/string) –
- The specific black hole spectra to plot. (e.g “blr”)
If True all spectra are plotted.
If a list of strings each specific spectra is plotted.
If a single string then only that spectra is plotted.
show (bool) – Flag for whether to show the plot or just return the figure and axes.
ylimits (tuple) – The limits to apply to the y axis. If not provided the limits will be calculated with the lower limit set to 1000 (100) times less than the peak of the spectrum for rest_frame (observed) spectra.
xlimits (tuple) – The limits to apply to the x axis. If not provided the optimal limits are found based on the ylimits.
figsize (tuple) – Tuple with size 2 defining the figure size.
quantity_to_plot (string) – The sed property to plot. Can be “lnu”, “luminosity” or “llam” for rest frame spectra or “fnu”, “flam” or “flux” for observed spectra. Defaults to “lnu”.
- Returns:
- fig (matplotlib.pyplot.figure)
The matplotlib figure object for the plot.
- ax (matplotlib.axes)
The matplotlib axes object containing the plotted data.
- plot_spectroscopy(instrument_label, combined_spectra=True, stellar_spectra=False, gas_spectra=False, black_hole_spectra=False, show=False, ylimits=(), xlimits=(), figsize=(3.5, 5), quantity_to_plot='lnu', fig=None, ax=None)[source]
Plot an instrument’s spectroscopy.
This will plot the spectroscopy for the galaxy and its components using the instrument’s wavelength array. The spectra are plotted in the order they are stored in the spectroscopy dictionary.
- Parameters:
instrument_label (str) – The label of the instrument whose spectroscopy to plot.
combined_spectra (bool/list, string/string) –
- The specific combined galaxy spectra to plot. (e.g “total”)
If True all spectra are plotted.
If a list of strings each specifc spectra is plotted.
If a single string then only that spectra is plotted.
stellar_spectra (bool/list, string/string) –
- The specific stellar spectra to plot. (e.g. “incident”)
If True all spectra are plotted.
If a list of strings each specifc spectra is plotted.
If a single string then only that spectra is plotted.
gas_spectra (bool/list, string/string) –
- The specific gas spectra to plot. (e.g. “total”)
If True all spectra are plotted.
If a list of strings each specifc spectra is plotted.
If a single string then only that spectra is plotted.
black_hole_spectra (bool/list, string/string) –
- The specific black hole spectra to plot. (e.g “blr”)
If True all spectra are plotted.
If a list of strings each specifc spectra is plotted.
If a single string then only that spectra is plotted.
show (bool) – Flag for whether to show the plot or just return the figure and axes.
ylimits (tuple) – The limits to apply to the y axis. If not provided the limits will be calculated with the lower limit set to 1000 (100) times less than the peak of the spectrum for rest_frame (observed) spectra.
xlimits (tuple) – The limits to apply to the x axis. If not provided the optimal limits are found based on the ylimits.
figsize (tuple) – Tuple with size 2 defining the figure size.
quantity_to_plot (string) – The sed property to plot. Can be “lnu”, “luminosity” or “llam” for rest frame spectra or “fnu”, “flam” or “flux” for observed spectra. Defaults to “lnu”.
fig (matplotlib.pyplot.figure) – The matplotlib figure object to plot on. If None a new figure is created.
ax (matplotlib.axes) – The matplotlib axes object to plot on. If None a new axes is created.
- Returns:
- fig (matplotlib.pyplot.figure)
The matplotlib figure object for the plot.
- ax (matplotlib.axes)
The matplotlib axes object containing the plotted data.
- print_used_parameters(*models)[source]
Print the parameters used by emission models in a formatted table.
This method displays all parameters that have been cached during emission model calculations, organized by model label. Each model’s parameters are shown with their computed values.
The output is formatted using TableFormatter to match the style of other print methods in synthesizer.
- Parameters:
*models (str) – Optional model labels to print. If provided, only the specified models will be printed. If not provided, all cached models will be printed from all components (stars, black holes, and galaxy).
Examples using synthesizer.base_galaxy.BaseGalaxy

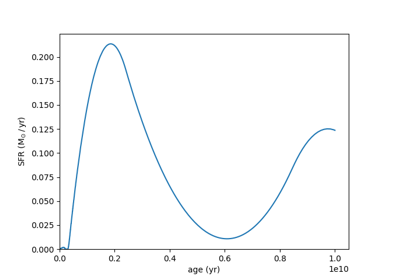
Demonstrate the dense basis approach for describing the SFZH

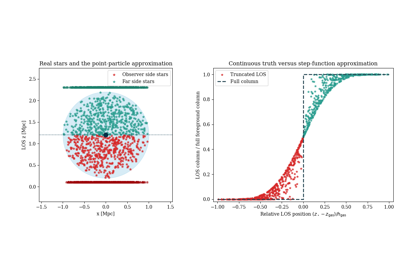
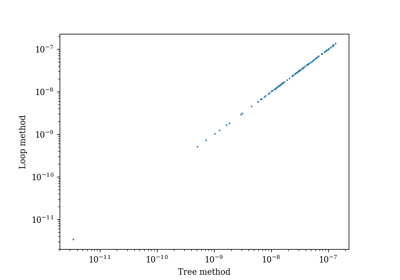
Point LOS Column Densities With A Truncated Source Kernel
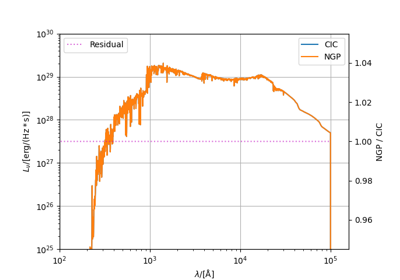
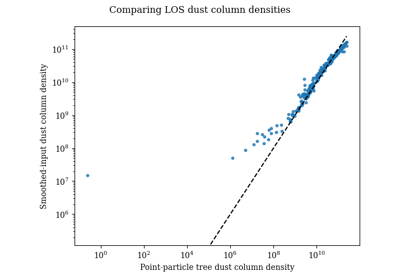
Compare smoothed and point-particle LOS column densities