Note
Go to the end to download the full example code.
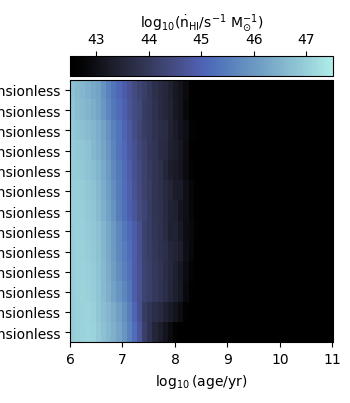
Plot ionising luminosity
Makes a plot of the specific ionising luminosity for a given choice of grid and ion.
import argparse

import matplotlib.pyplot as plt

from synthesizer.grid import Grid

if __name__ == "__main__":
    # initialise argument parser
    parser = argparse.ArgumentParser(
        description=(
            "Create a plot of all spectra types for a given metallicity and \
            age"
        )
    )

    # The name of the grid. Defaults to the test grid.
    parser.add_argument(
        "-grid_name",
        "--grid_name",
        type=str,
        required=False,
        default="test_grid",
    )

    # The desired ion.
    parser.add_argument("-ion", type=str, required=False, default="HI")

    # Get dictionary of arguments
    args, _ = parser.parse_known_args()

    # initialise grid
    grid = Grid(args.grid_name)

    # plot grid of HI ionising luminosities
    fig, ax = grid.plot_specific_ionising_lum(ion=args.ion)
    plt.show()
Total running time of the script: (0 minutes 0.156 seconds)