Note
Go to the end to download the full example code.
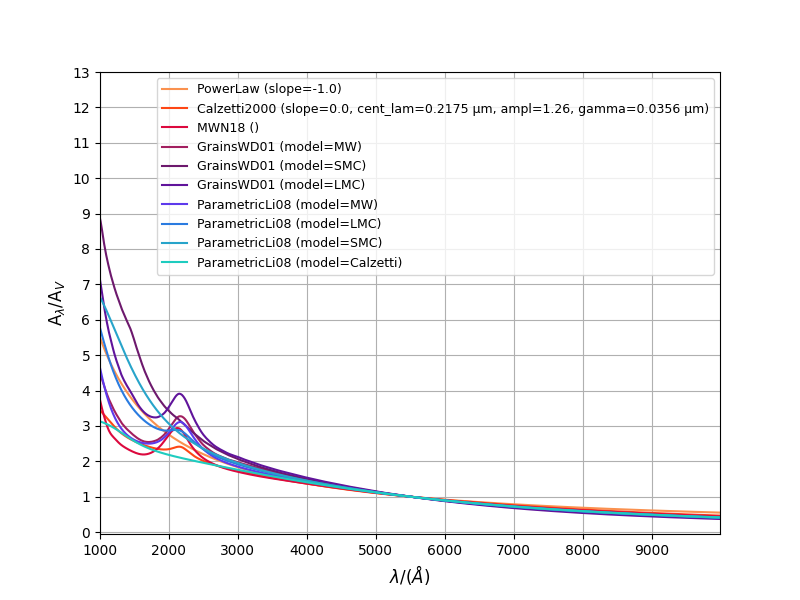
Dust curves example
Plot dust curves
import cmasher as cmr
import matplotlib.pyplot as plt
import numpy as np
from unyt import Angstrom, um, unyt_quantity

from synthesizer.emission_models import attenuation

models = [
    "PowerLaw",
    "Calzetti2000",
    "MWN18",
    "GrainModels",
    "GrainModels",
    "GrainModels",
    "ParametricLi08",
    "ParametricLi08",
    "ParametricLi08",
    "ParametricLi08",
]

params = [
    {"slope": -1.0},
    {
        "slope": 0.0,
        "cent_lam": 0.2175 * um,
        "ampl": 1.26,
        "gamma": 0.0356 * um,
    },
    {},
    {"model": "WD01", "submodel": "MW"},
    {"model": "WD01", "submodel": "SMC"},
    {"model": "WD01", "submodel": "LMC"},
    {"model": "MW"},
    {"model": "LMC"},
    {"model": "SMC"},
    {"model": "Calzetti"},
]

colors = cmr.take_cmap_colors("cmr.guppy", len(models))

lam = np.arange(1000, 10000, 10) * Angstrom

fig = plt.figure(figsize=(8, 6))
ax = fig.add_subplot(111)

for ii, (model, param) in enumerate(zip(models, params)):
    emodel = getattr(attenuation, model)(**param)

    # Convert param to a nice string
    param_strs = []
    for p, v in param.items():
        if isinstance(v, unyt_quantity):
            param_strs.append(f"{p}={v.value} {v.units}")
        else:
            param_strs.append(f"{p}={v}")

    param = ", ".join(param_strs)

    ax.plot(
        lam, emodel.get_tau(lam), color=colors[ii], label=f"{model} ({param})"
    )

ax.set_xlabel(r"$\lambda/(\AA)$", fontsize=12)
ax.set_ylabel(r"A$_{\lambda}/$A$_{V}$", fontsize=12)
ax.set_yticks(np.arange(0, 14))
ax.set_xlim(np.min(lam), np.max(lam))

ax.legend(fontsize=9, loc="upper right")
ax.grid(True)

plt.show()
Total running time of the script: (0 minutes 0.175 seconds)