synthesizer.emissions.line_ratios
A module holding useful line ratios.
This contains both line ratios and diagnostic diagrams for emission line. As well as including the standard line labels for common lines.
Line ids and specifically the wavelength part here are defined using the cloudy standard, i.e. using vacuum wavelengths at <200nm and air wavelengths at >200nm.
Functions
- synthesizer.emissions.line_ratios.get_bpt_kauffman03(logNII_Ha)[source]
BPT-NII demarcations from Kauffman+2003.
Kauffman+03: https://arxiv.org/abs/astro-ph/0304239
Demarcation defined by:
log([OIII]/Hb) = 0.61 / (log([NII]/Ha) - 0.05) + 1.3
- Parameters:
logNII_Ha (np.ndarray of float) – Array of log([NII]/Halpha) values to give the SF-AGN demarcation line
- Returns:
- array
Corresponding log([OIII]/Hb) ratio array
- synthesizer.emissions.line_ratios.get_bpt_kewley01(logNII_Ha)[source]
BPT-NII demarcations from Kewley+2001.
Kewley+03: https://arxiv.org/abs/astro-ph/0106324
Demarcation defined by:
log([OIII]/Hb) = 0.61 / (log([NII]/Ha) - 0.47) + 1.19
- Parameters:
logNII_Ha (np.ndarray of float) – Array of log([NII]/Halpha) values to give the SF-AGN demarcation line
- Returns:
Corresponding log([OIII]/Hb) ratio array
- Return type:
array
- synthesizer.emissions.line_ratios.get_diagram_labels(diagram_id)[source]
Get a x and y labels for a given diagram_id.
- Parameters:
diagram_id (str) – The diagram identificantion, e.g. OHNO.
- Returns:
A string representation of the x-label. ylabel (str):
A string representation of the y-label.
- Return type:
xlabel (str)
Examples using synthesizer.emissions.line_ratios.get_diagram_labels
Examples using synthesizer.emissions.line_ratios.get_ratio_label
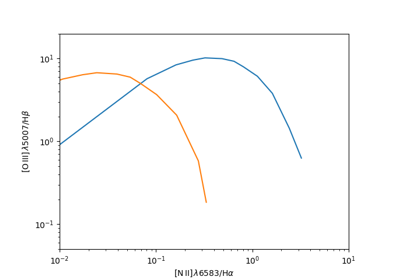
- synthesizer.emissions.line_ratios.plot_bpt_kauffman03(logNII_Ha, fig=None, ax=None, show=True, xlimits=(0.01, 10), ylimits=(0.05, 20), **kwargs)[source]
Plot the BPT-NII demarcations from Kauffman+2003.
Kauffman+03: https://arxiv.org/abs/astro-ph/0304239
Demarcation defined by:
log([OIII]/Hb) = 0.61 / (log([NII]/Ha) - 0.05) + 1.3
- Parameters:
logNII_Ha (np.ndarray of float) – Array of log([NII]/Halpha) values to give the SF-AGN demarcation line.
fig (matplotlib.figure.Figure) – Optional figure to plot on.
ax (matplotlib.axes.Axes) – Optional axis to plot on.
show (bool) – Should we show the plot?
xlimits (tuple) – The x-axis limits.
ylimits (tuple) – The y-axis limits.
**kwargs (dict) – Any additional keyword arguments to pass to the plot.
- Returns:
- fig, ax
The figure and axis objects
- synthesizer.emissions.line_ratios.plot_bpt_kewley01(logNII_Ha, fig=None, ax=None, show=True, xlimits=(0.01, 10), ylimits=(0.05, 20), **kwargs)[source]
Plot the BPT-NII demarcations from Kewley+2001.
Kewley+03: https://arxiv.org/abs/astro-ph/0106324
Demarcation defined by:
log([OIII]/Hb) = 0.61 / (log([NII]/Ha) - 0.47) + 1.19
- Parameters:
logNII_Ha (np.ndarray of float) – Array of log([NII]/Halpha) values to give the SF-AGN demarcation line.
fig (matplotlib.figure.Figure) – Optional figure to plot on,
ax (matplotlib.axes.Axes) – Optional axis to plot on.
show (bool) – Should we show the plot?
xlimits (tuple) – The x-axis limits.
ylimits (tuple) – The y-axis limits.
**kwargs (dict) – Any additional keyword arguments to pass to the plot.
- Returns:
- fig, ax
The figure and axis objects