Spectroscopy with Instruments
If you have an instrument with a wavelength array you can produce spectroscopy from any spectra generated by Synthesizer.
For this you simply need a galaxy or component with spectra and an instrument defining a wavelength array. Below we set up the galaxy and generate it’s spectra.
[1]:
import numpy as np
from unyt import Mpc, Msun, Myr, kelvin, yr

from synthesizer.emission_models import (
    BimodalPacmanEmission,
)
from synthesizer.emission_models.attenuation import PowerLaw
from synthesizer.emission_models.dust.emission import Blackbody
from synthesizer.grid import Grid
from synthesizer.parametric import SFH, ZDist
from synthesizer.parametric import Stars as ParametricStars
from synthesizer.particle import BlackHoles, Galaxy
from synthesizer.particle.stars import sample_sfzh

# Get the grids which we'll need for extraction
grid_dir = "../../../tests/test_grid"
grid_name = "test_grid"
grid = Grid(grid_name, grid_dir=grid_dir)
nlr_grid = Grid("test_grid_agn-nlr", grid_dir="../../../tests/test_grid")
blr_grid = Grid("test_grid_agn-blr", grid_dir="../../../tests/test_grid")

# Get the stellar pacman model
pc_model = BimodalPacmanEmission(
    grid=grid,
    tau_v_ism=1.0,
    tau_v_birth=0.7,
    dust_curve_ism=PowerLaw(slope=-1.3),
    dust_curve_birth=PowerLaw(slope=-0.7),
    dust_emission_ism=Blackbody(temperature=100 * kelvin),
    dust_emission_birth=Blackbody(temperature=30 * kelvin),
    fesc=0.2,
    fesc_ly_alpha=0.9,
    label="stellar_total",
)
pc_model.save_spectra("reprocessed", "attenuated", "stellar_total")

# Define the metallicity history
zh = ZDist.DeltaConstant(metallicity=0.01)

# Define the star formation history
sfh_p = {"max_age": 100 * Myr}
sfh = SFH.Constant(**sfh_p)

# Initialise the parametric Stars object
param_stars = ParametricStars(
    grid.log10age,
    grid.metallicity,
    sf_hist=sfh,
    metal_dist=zh,
    initial_mass=10**9 * Msun,
)

# Define the number of stellar particles we want
n = 10000

# Sample the parametric SFZH, producing a particle Stars object
# we will also pass some keyword arguments for some example attributes
part_stars = sample_sfzh(
    sfzh=param_stars.sfzh,
    log10ages=param_stars.log10ages,
    log10metallicities=param_stars.log10metallicities,
    nstar=n,
    current_masses=np.full(n, 10**8.7 / n) * Msun,
    redshift=1,
)

# Make fake properties
n = 4
masses = 10 ** np.random.uniform(low=7, high=9, size=n) * Msun
coordinates = np.random.normal(0, 1.5, (n, 3)) * Mpc
accretion_rates = 10 ** np.random.uniform(low=-2, high=1, size=n) * Msun / yr
metallicities = np.full(n, 0.01)

# And get the black holes object
blackholes = BlackHoles(
    masses=masses,
    coordinates=coordinates,
    accretion_rates=accretion_rates,
    metallicities=metallicities,
)

# And create the galaxy
galaxy = Galaxy(
    stars=part_stars,
    black_holes=blackholes,
    redshift=1,
)

# Get the stellar spectra
galaxy.get_spectra(pc_model)
/opt/hostedtoolcache/Python/3.10.17/x64/lib/python3.10/site-packages/unyt/array.py:1832: RuntimeWarning: divide by zero encountered in log10
  out_arr = func(np.asarray(inp), out=out_func, **kwargs)
/opt/hostedtoolcache/Python/3.10.17/x64/lib/python3.10/site-packages/unyt/array.py:1832: RuntimeWarning: overflow encountered in exp
  out_arr = func(np.asarray(inp), out=out_func, **kwargs)
/opt/hostedtoolcache/Python/3.10.17/x64/lib/python3.10/site-packages/unyt/array.py:1972: RuntimeWarning: overflow encountered in multiply
  out_arr = func(
[1]:
<synthesizer.emissions.sed.Sed at 0x7fc19a70f070>
Next we need an instrument capable of spectroscopy. For this purpose we’ll make a simple fake Instrument class with a wavelength array.
[2]:
from unyt import angstrom

from synthesizer.instruments import Instrument

# Instatiate the instruments
inst = Instrument("Spectrometer", lam=np.logspace(3, 4, 100) * angstrom)

print(inst)
+----------------------------------------------------------------------------------+
|                                    INSTRUMENT                                    |
+------------------------------------+---------------------------------------------+
| Attribute                          | Value                                       |
+------------------------------------+---------------------------------------------+
| label                              | 'Spectrometer'                              |
+------------------------------------+---------------------------------------------+
| can_do_imaging                     | False                                       |
+------------------------------------+---------------------------------------------+
| can_do_noisy_imaging               | False                                       |
+------------------------------------+---------------------------------------------+
| can_do_noisy_resolved_spectroscopy | False                                       |
+------------------------------------+---------------------------------------------+
| can_do_noisy_spectroscopy          | False                                       |
+------------------------------------+---------------------------------------------+
| can_do_photometry                  | False                                       |
+------------------------------------+---------------------------------------------+
| can_do_psf_imaging                 | False                                       |
+------------------------------------+---------------------------------------------+
| can_do_psf_spectroscopy            | False                                       |
+------------------------------------+---------------------------------------------+
| can_do_resolved_spectroscopy       | False                                       |
+------------------------------------+---------------------------------------------+
| can_do_spectroscopy                | True                                        |
+------------------------------------+---------------------------------------------+
| lam (100,)                         | 1.00e+03 Å -> 1.00e+04 Å (Mean: 3.92e+03 Å) |
+------------------------------------+---------------------------------------------+
Finally, to actually generate the spectra all we need to go is call the get_spectroscopy method with our instrument from either the galaxy or component. This will store the generated spectroscopy in the spectroscopy attribute of the galaxy or component.
[3]:
galaxy.get_spectroscopy(inst)
print(galaxy.stars.spectroscopy)
{'Spectrometer': {'stellar_total': <synthesizer.emissions.sed.Sed object at 0x7fc1ea992e00>, 'attenuated': <synthesizer.emissions.sed.Sed object at 0x7fc1e853a170>, 'reprocessed': <synthesizer.emissions.sed.Sed object at 0x7fc1e853b370>}}
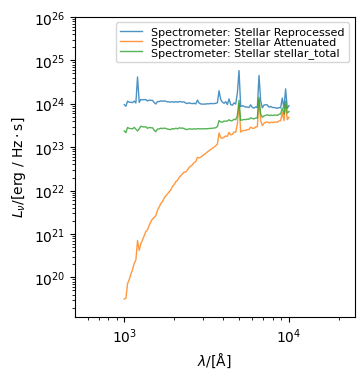
We can plot the spectroscopy using the plot_spectroscopy method on the galaxy or component.
[4]:
galaxy.plot_spectroscopy(
    inst.label,
    stellar_spectra=True,
    show=True,
)
[4]:
(<Figure size 350x500 with 1 Axes>,
 <Axes: xlabel='$\\lambda/[\\mathrm{\\AA}]$', ylabel='$L_{\\nu}/[\\mathrm{\\rm{erg} \\ / \\ \\rm{Hz \\cdot \\rm{s}}}]$'>)
If you generate observed spectra then the observed spectroscopy is automatically generated alongside the rest frame spectroscopy. Once generated this can be plotted using the plot_observed_spectroscopy method on a galaxy.
[5]:
from astropy.cosmology import Planck18 as cosmo

# Get the observed spectra
galaxy.get_observed_spectra(cosmo=cosmo)

# Generate the specroscopy again (this will now do both the
# observed and rest-frame)
galaxy.get_spectroscopy(inst)

# Plot the observed spectra
galaxy.plot_observed_spectroscopy(
    inst.label,
    stellar_spectra=True,
    show=True,
)

[5]:
(<Figure size 350x500 with 1 Axes>,
 <Axes: xlabel='$\\lambda_\\mathrm{obs}/[\\mathrm{\\AA}]$', ylabel='$F_{\\nu}/[\\mathrm{\\rm{nJy}}]$'>)